Fig. 15
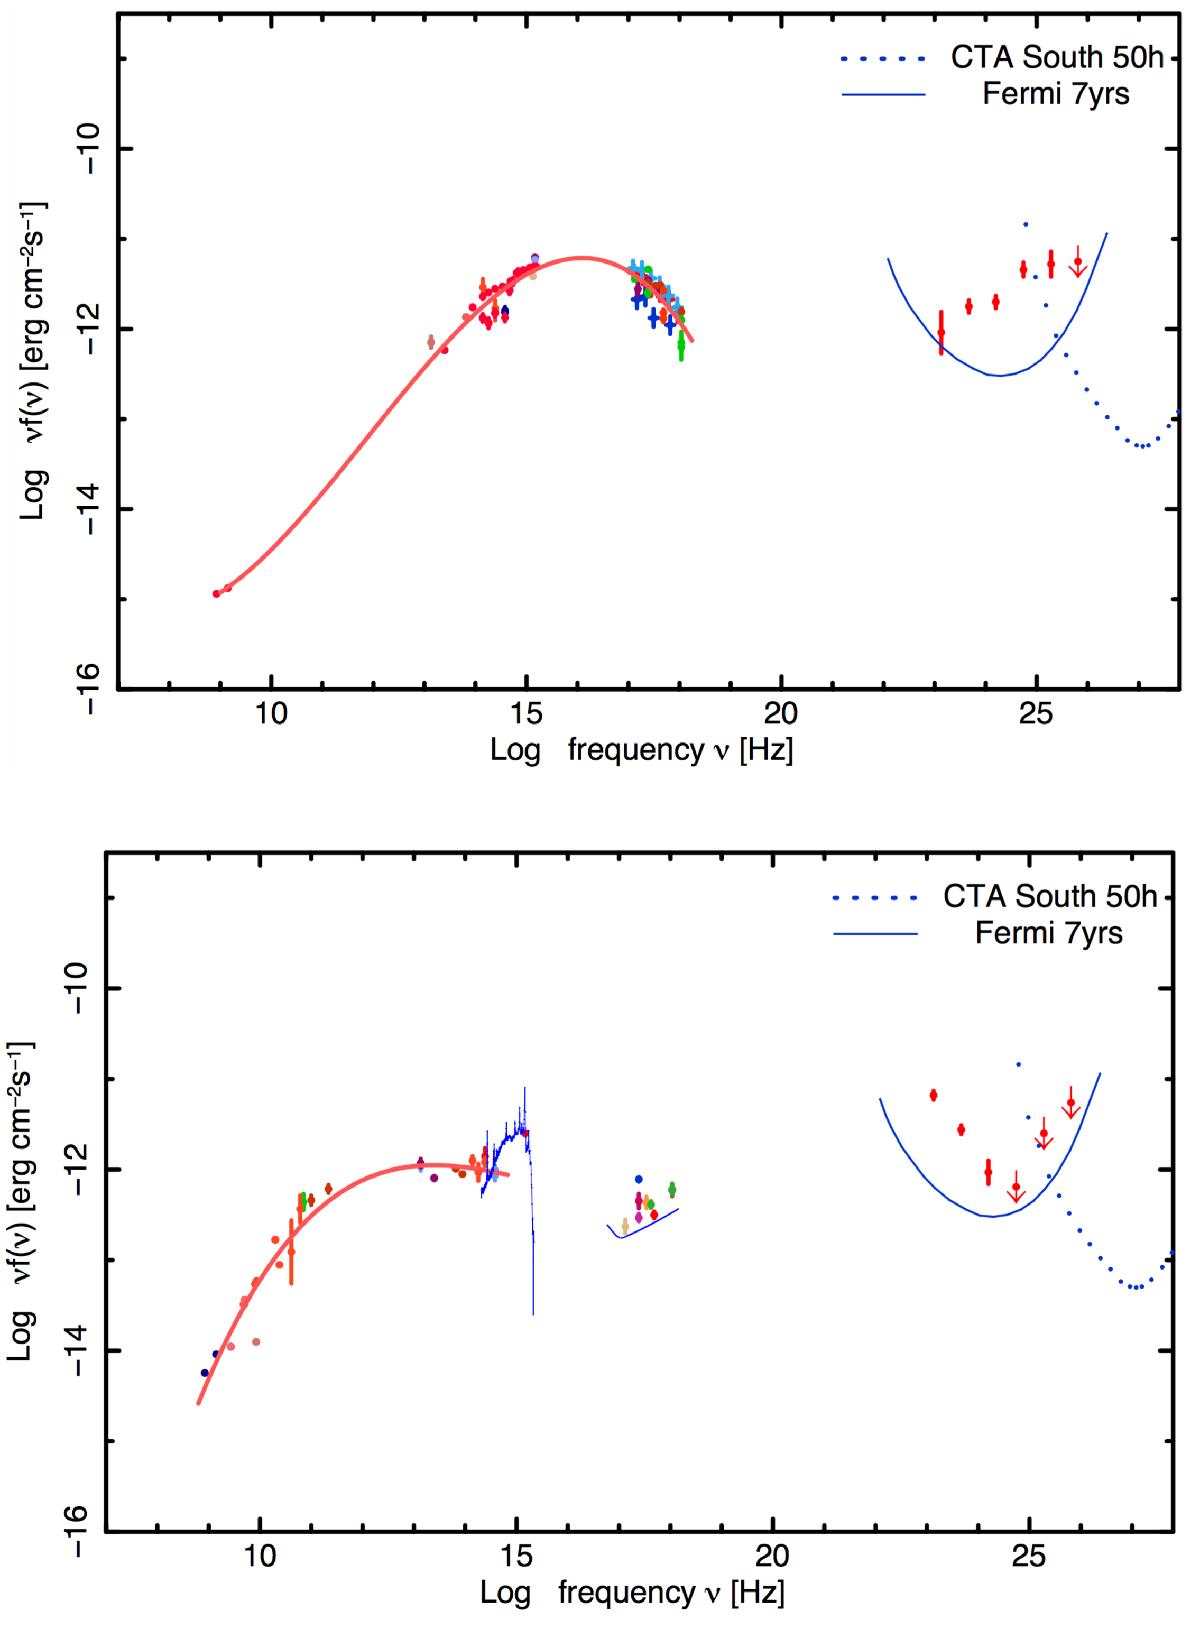
Top panel: multifrequency SED for 2WHSP J053628.9−334301; source with hard γ-ray spectrum ΓWHSP = 1.76. Bottom panel: multifrequency SED for 5BZQ J0536−3401; source with steep γ-ray spectrum ΓBZQ = 2.75 (also showing the FSRQ template (Vanden Berk et al. 2001) as a thin blue-line along the optical to X-ray band). In the GeV−TeV band, both plots show the sensitivity curve for Fermi-LAT 7 yr broadband detection, and for CTA-South considering 50h of exposure.
Current usage metrics show cumulative count of Article Views (full-text article views including HTML views, PDF and ePub downloads, according to the available data) and Abstracts Views on Vision4Press platform.
Data correspond to usage on the plateform after 2015. The current usage metrics is available 48-96 hours after online publication and is updated daily on week days.
Initial download of the metrics may take a while.