Fig. 10
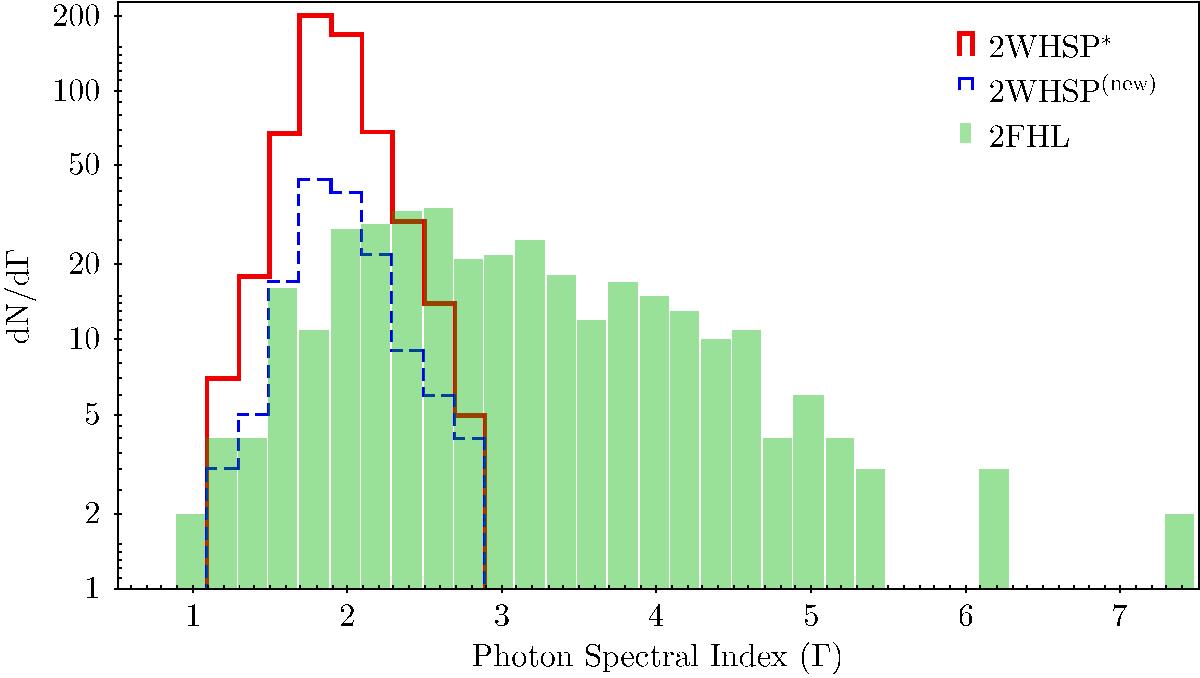
Histogram comparing the photon spectrum index (Γ) distribution for the γ-ray samples 2FHL (all sources), 2WHSP∗ (all γ-ray detected 2WHSPs down to TS = 10), and 2WHSP(new) (only the 150 new γ-ray detections). Note that this is a qualitative comparison given that Γ parameter for the 2FHL sample is measured in the 50 GeV−2 TeV energy band.
Current usage metrics show cumulative count of Article Views (full-text article views including HTML views, PDF and ePub downloads, according to the available data) and Abstracts Views on Vision4Press platform.
Data correspond to usage on the plateform after 2015. The current usage metrics is available 48-96 hours after online publication and is updated daily on week days.
Initial download of the metrics may take a while.