Free Access
Fig. 11
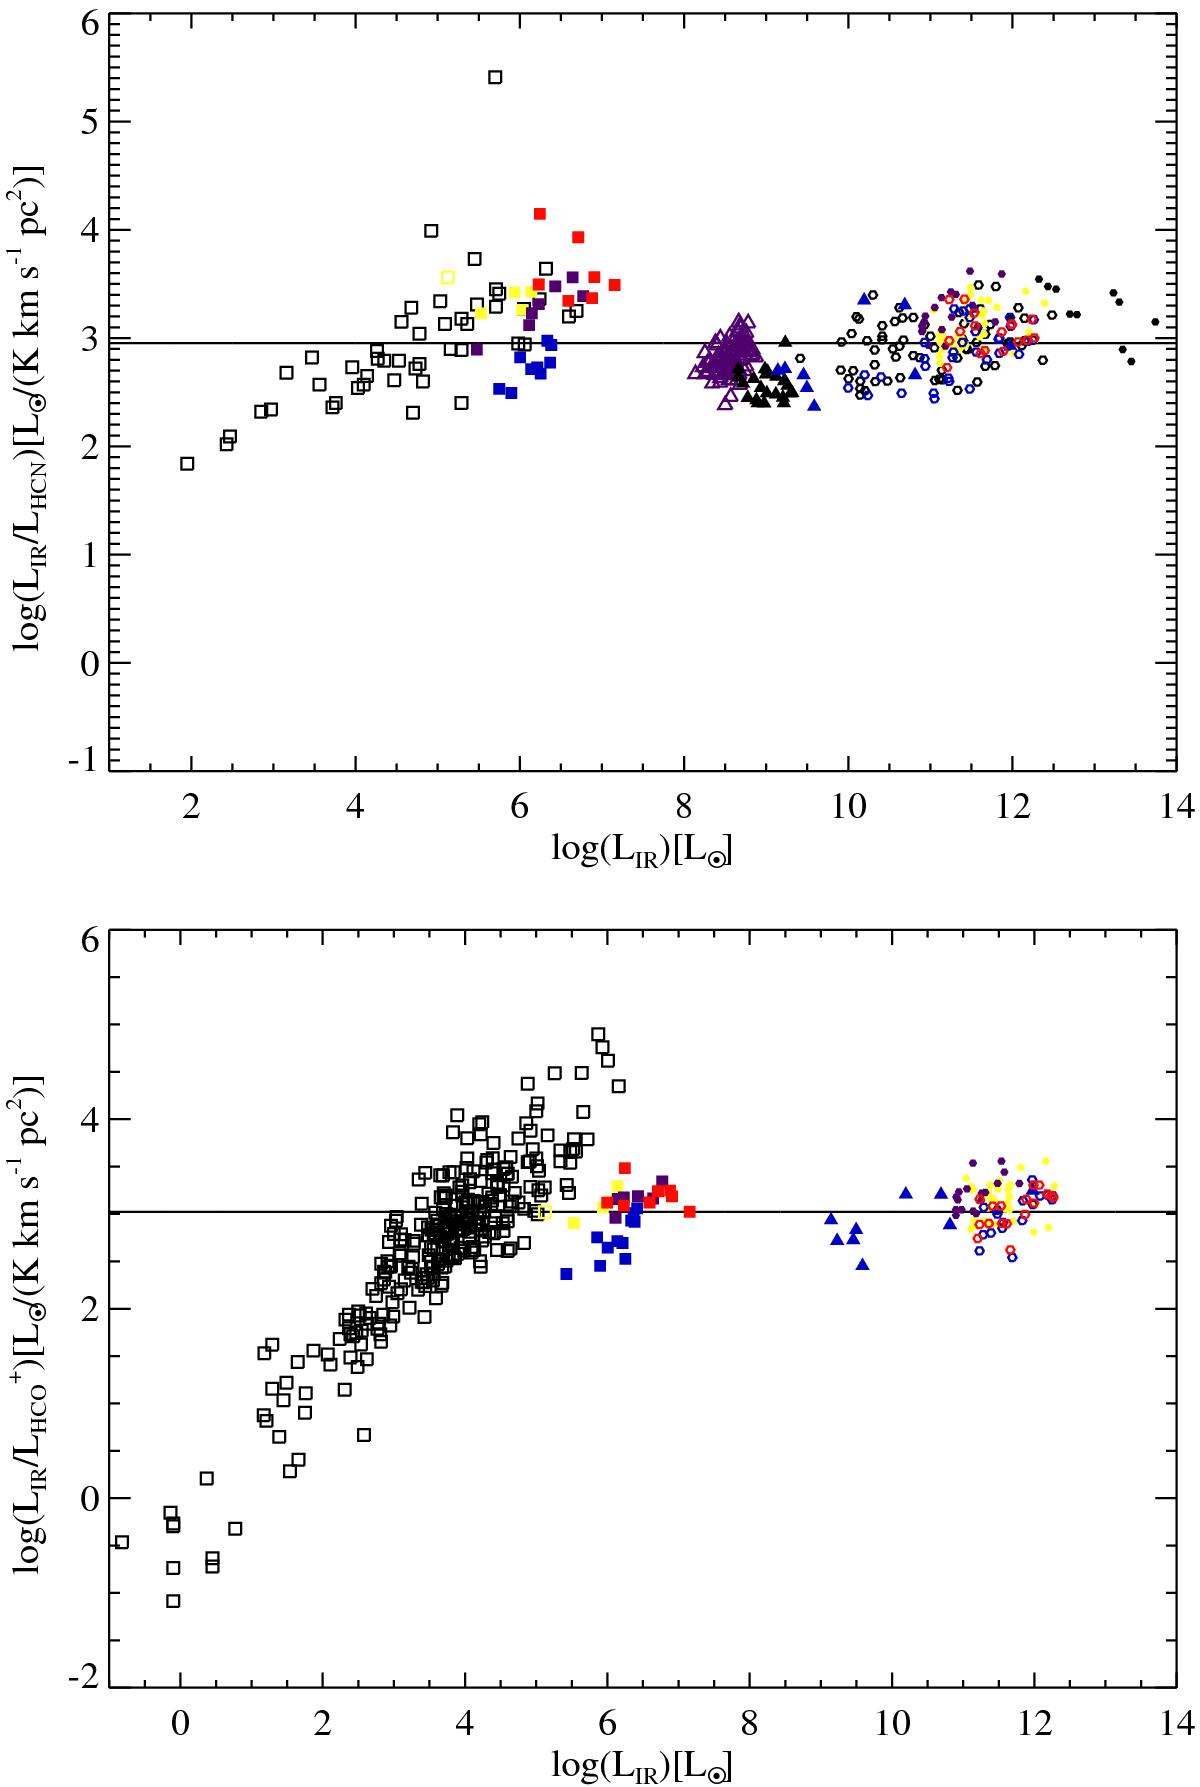
Ratio between IR and HCN (upper panel) and HCO+ (Lower panel) luminosities as a function of IR luminosity. The goal here is to see finer structure than in the previous figure as the vertical scale has been greatly expanded. References are as given in Fig. 10.
This figure is made of several images, please see below:
Current usage metrics show cumulative count of Article Views (full-text article views including HTML views, PDF and ePub downloads, according to the available data) and Abstracts Views on Vision4Press platform.
Data correspond to usage on the plateform after 2015. The current usage metrics is available 48-96 hours after online publication and is updated daily on week days.
Initial download of the metrics may take a while.