Fig. 6
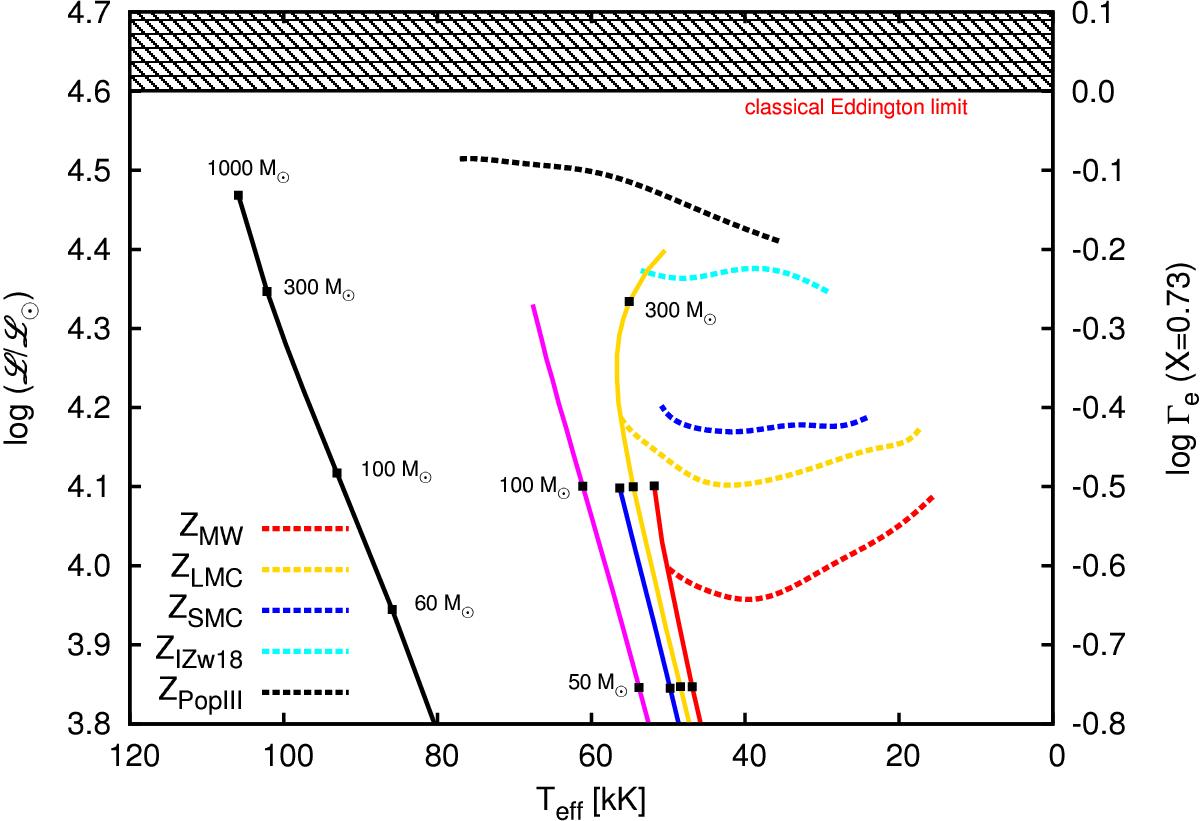
Spectroscopic HR diagram showing the boundaries (dotted lines) between non-inflated and inflated models for different metallicities such that below a given line, we do not find any inflated model for that metallicity. The solid lines represent the ZAMS. The masses at ZAMS for some of the models have been indicated. The right Y-axis represents the logarithm of the classical Eddington factor considering X = 0.73, similar to Figs. 3 and 5. The horizontal line marks the location Γe = 1 and the hatched region above it is the forbidden zone where no hydrostatic model can lie.
Current usage metrics show cumulative count of Article Views (full-text article views including HTML views, PDF and ePub downloads, according to the available data) and Abstracts Views on Vision4Press platform.
Data correspond to usage on the plateform after 2015. The current usage metrics is available 48-96 hours after online publication and is updated daily on week days.
Initial download of the metrics may take a while.