Fig. 3
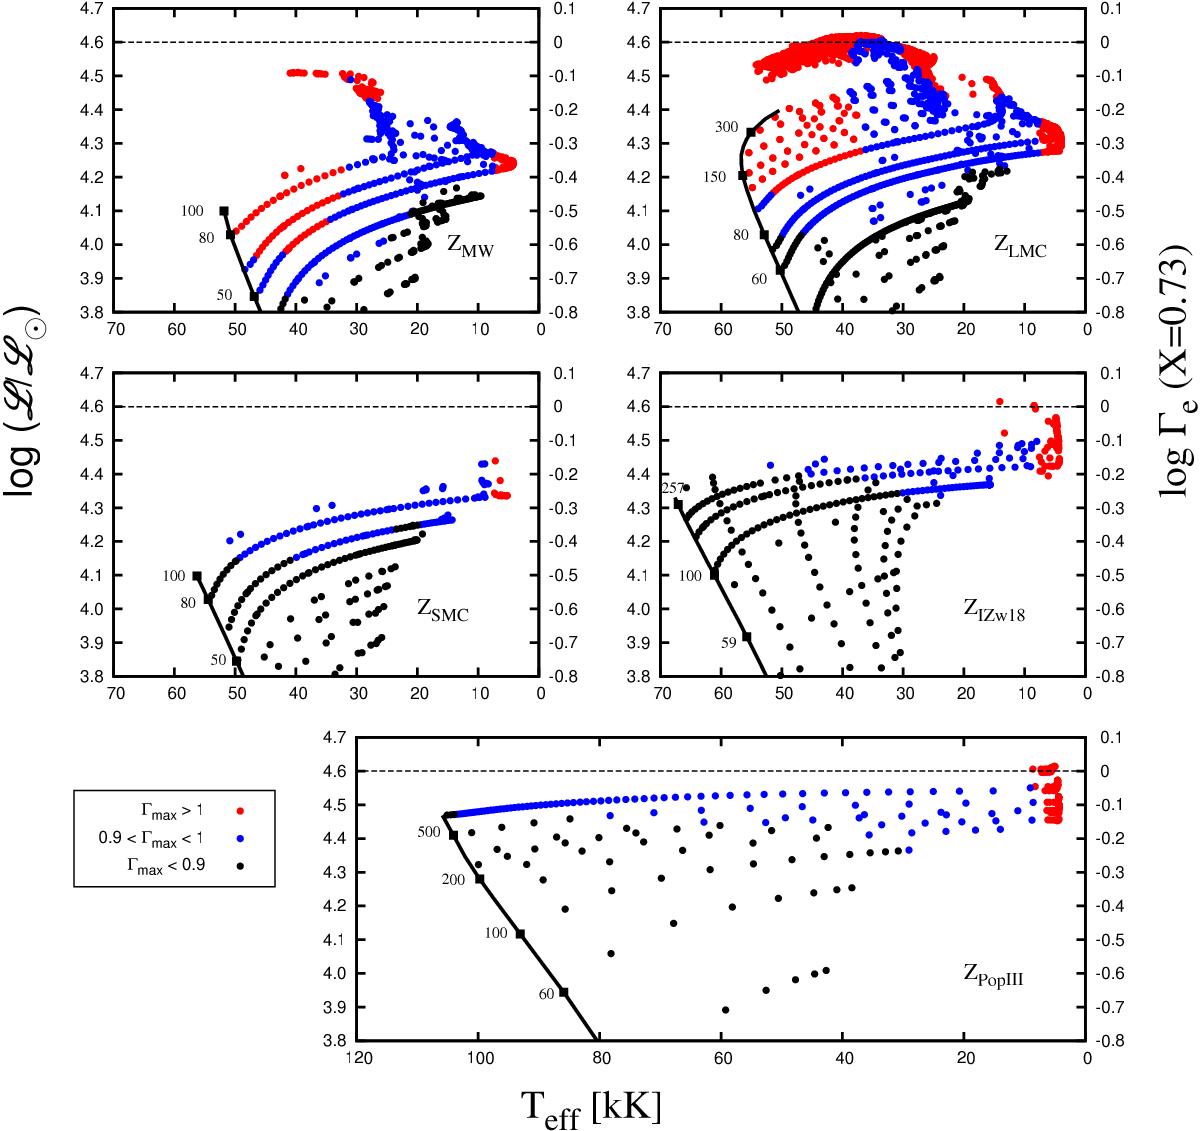
Spectroscopic Hertzsprung-Russell diagrams showing the non-rotating and slowly rotating core-hydrogen burning models in the five grids corresponding to the different metallicities (see labels). The left Y-axis shows the quantity log (L/ L⊙) with ![]() whereas the right Y-axis shows the corresponding values of log (Γe), in all the five panels. The Γe values are computed at the stellar surface considering electron-scattering opacity with a hydrogen abundance of X = 0.73 (completely ionised), and the black dotted line marks the location Γe = 1. Note that the assumption of completely ionised hydrogen breaks down for models with Teff below ≈10 000 K. Black, blue, and red dots correspond to models with Γmax< 0.9, 0.9 < Γmax< 1, and Γmax> 1, respectively. Only the models with log (L/ L⊙) > 3.8 have been shown. The black solid line is the ZAMS, and the masses of some representative models (in units of M⊙) have been indicated.
whereas the right Y-axis shows the corresponding values of log (Γe), in all the five panels. The Γe values are computed at the stellar surface considering electron-scattering opacity with a hydrogen abundance of X = 0.73 (completely ionised), and the black dotted line marks the location Γe = 1. Note that the assumption of completely ionised hydrogen breaks down for models with Teff below ≈10 000 K. Black, blue, and red dots correspond to models with Γmax< 0.9, 0.9 < Γmax< 1, and Γmax> 1, respectively. Only the models with log (L/ L⊙) > 3.8 have been shown. The black solid line is the ZAMS, and the masses of some representative models (in units of M⊙) have been indicated.
Current usage metrics show cumulative count of Article Views (full-text article views including HTML views, PDF and ePub downloads, according to the available data) and Abstracts Views on Vision4Press platform.
Data correspond to usage on the plateform after 2015. The current usage metrics is available 48-96 hours after online publication and is updated daily on week days.
Initial download of the metrics may take a while.