Fig. 7
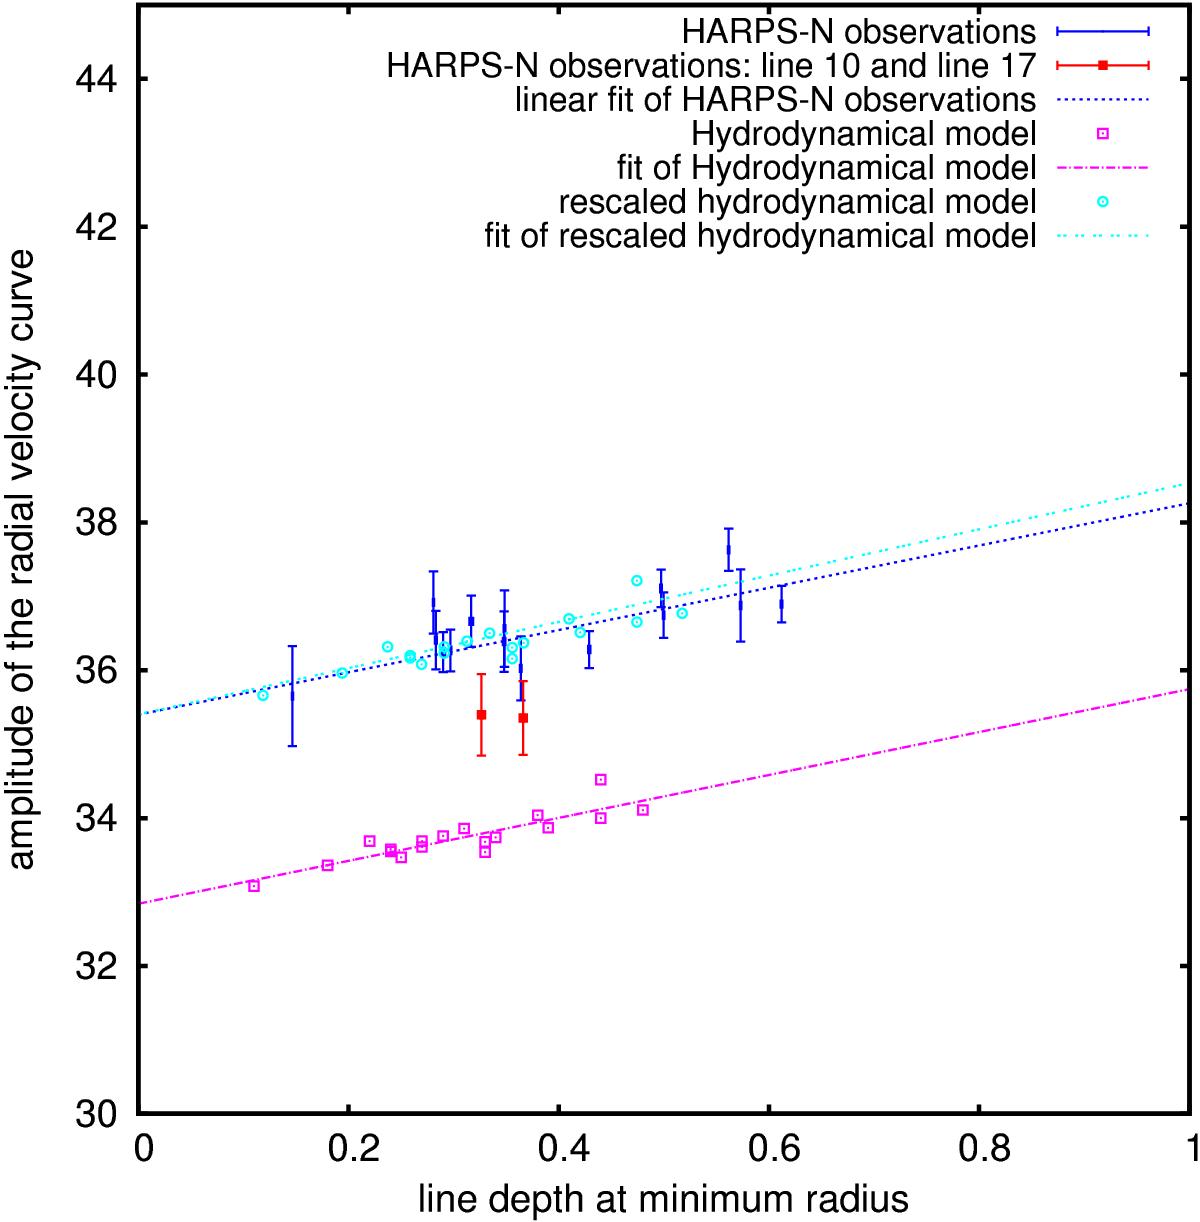
Amplitude of the radial velocity curves for the 17 spectral lines listed in Table 2 plotted versus the line depth for the hydrodynamical model (magenta squares), and for the HARPS-N spectroscopic observations (blue dots, except lines 10 and 17 plotted with filled red squares). A rescale of the model with a multiplying factor (i.e., fc) is necessary to fit the data (light blue circles).
Current usage metrics show cumulative count of Article Views (full-text article views including HTML views, PDF and ePub downloads, according to the available data) and Abstracts Views on Vision4Press platform.
Data correspond to usage on the plateform after 2015. The current usage metrics is available 48-96 hours after online publication and is updated daily on week days.
Initial download of the metrics may take a while.