Fig. 4
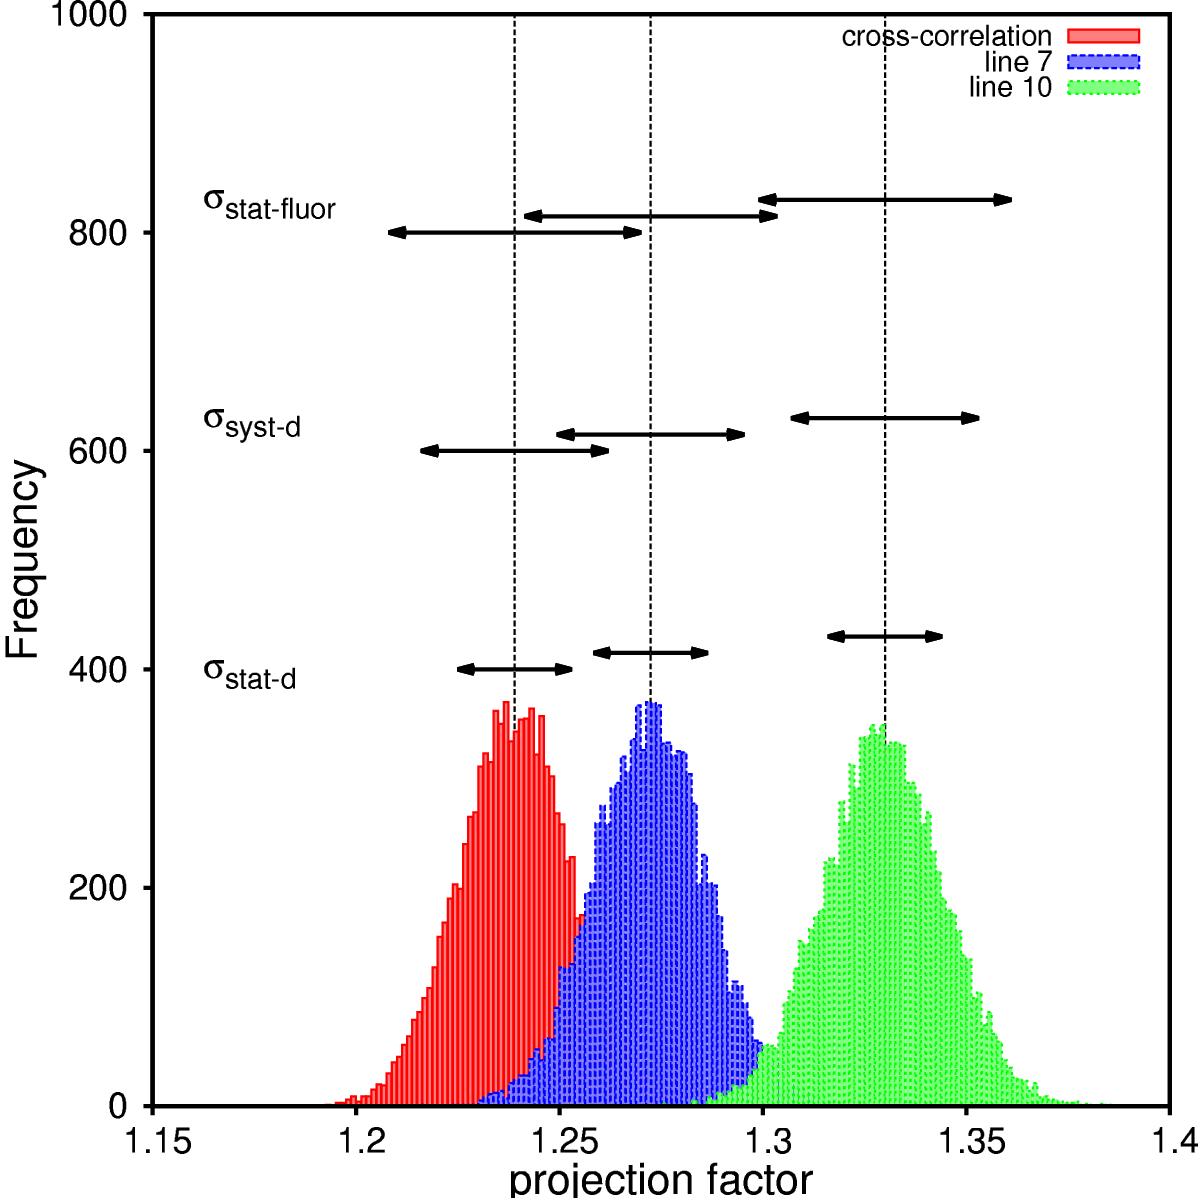
Inverse BW method described in Sect. 3 applied considering a Gaussian distribution for the distance. The resulting projection factor distributions are shown in three particular cases: when using the cross-correlated radial velocity curve RVcc−g (red), the RVc radial velocity curve of line 7 (blue), and the RVc radial velocity curve of line 10 (green). The quantities σstat−d and σsyst−d are the uncertainties on the projection factor due to the statistical and systematical uncertainties on the distance, respectively. The quantity σstat−fluor stems from the statistical uncertainties on the FLUOR/CHARA interferometric measurements.
Current usage metrics show cumulative count of Article Views (full-text article views including HTML views, PDF and ePub downloads, according to the available data) and Abstracts Views on Vision4Press platform.
Data correspond to usage on the plateform after 2015. The current usage metrics is available 48-96 hours after online publication and is updated daily on week days.
Initial download of the metrics may take a while.