Fig. 2
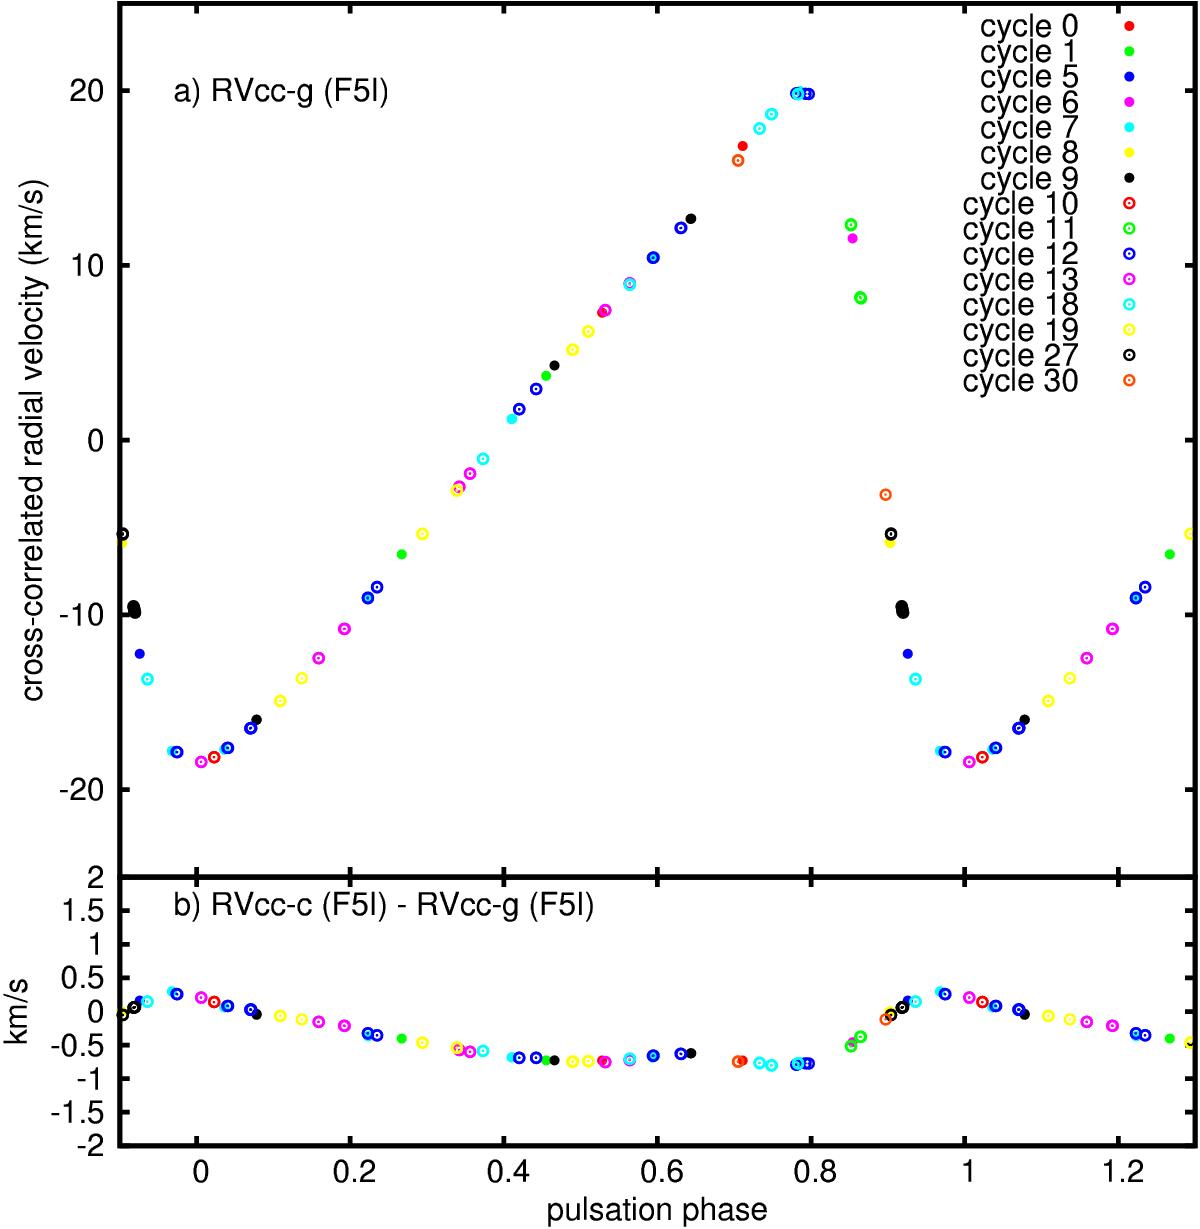
Panel a): HARPS-N radial velocities associated with the Gaussian fit of the cross-correlated line profile (RVcc−g using F5I template) plotted as a function of the pulsation phase of the star after correction of the γ-velocity (i.e., Vγ = −16.95km s-1 ). The cycle of observations are shown in different colors. The data are reproduced from one cycle to the other. The precision on the measurements is between 0.5 and 1.5 m s-1 (error bars are lower than symbols). Panel b) residuals between RVcc−c (F5I) and RVcc−g (F5I) after correction of their respective γ-velocities.
Current usage metrics show cumulative count of Article Views (full-text article views including HTML views, PDF and ePub downloads, according to the available data) and Abstracts Views on Vision4Press platform.
Data correspond to usage on the plateform after 2015. The current usage metrics is available 48-96 hours after online publication and is updated daily on week days.
Initial download of the metrics may take a while.