Fig. 10
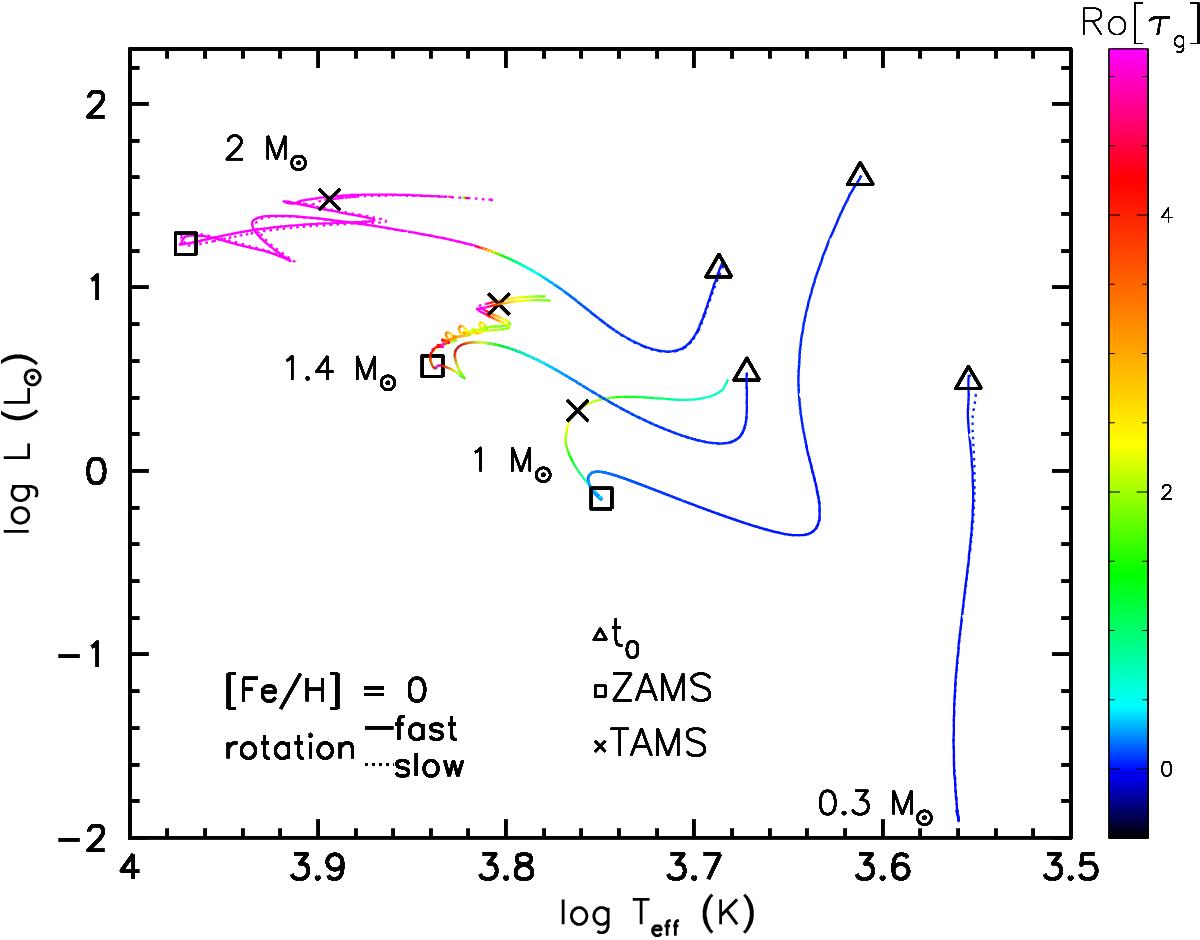
Variation of the global Rossby number (colour-coded) along the evolution tracks in the HRD for the 0.3, 1, 1.4, and 2 M⊙, Z⊙ models for the fast- and slow-rotating cases (solid and dashed lines, respectively). The triangles, squares and crosses represent the location in the HRD of the age of the first time step t0 in each STAREVOL model, ZAMS and TAMS, respectively.
Current usage metrics show cumulative count of Article Views (full-text article views including HTML views, PDF and ePub downloads, according to the available data) and Abstracts Views on Vision4Press platform.
Data correspond to usage on the plateform after 2015. The current usage metrics is available 48-96 hours after online publication and is updated daily on week days.
Initial download of the metrics may take a while.