Free Access
Fig. 3
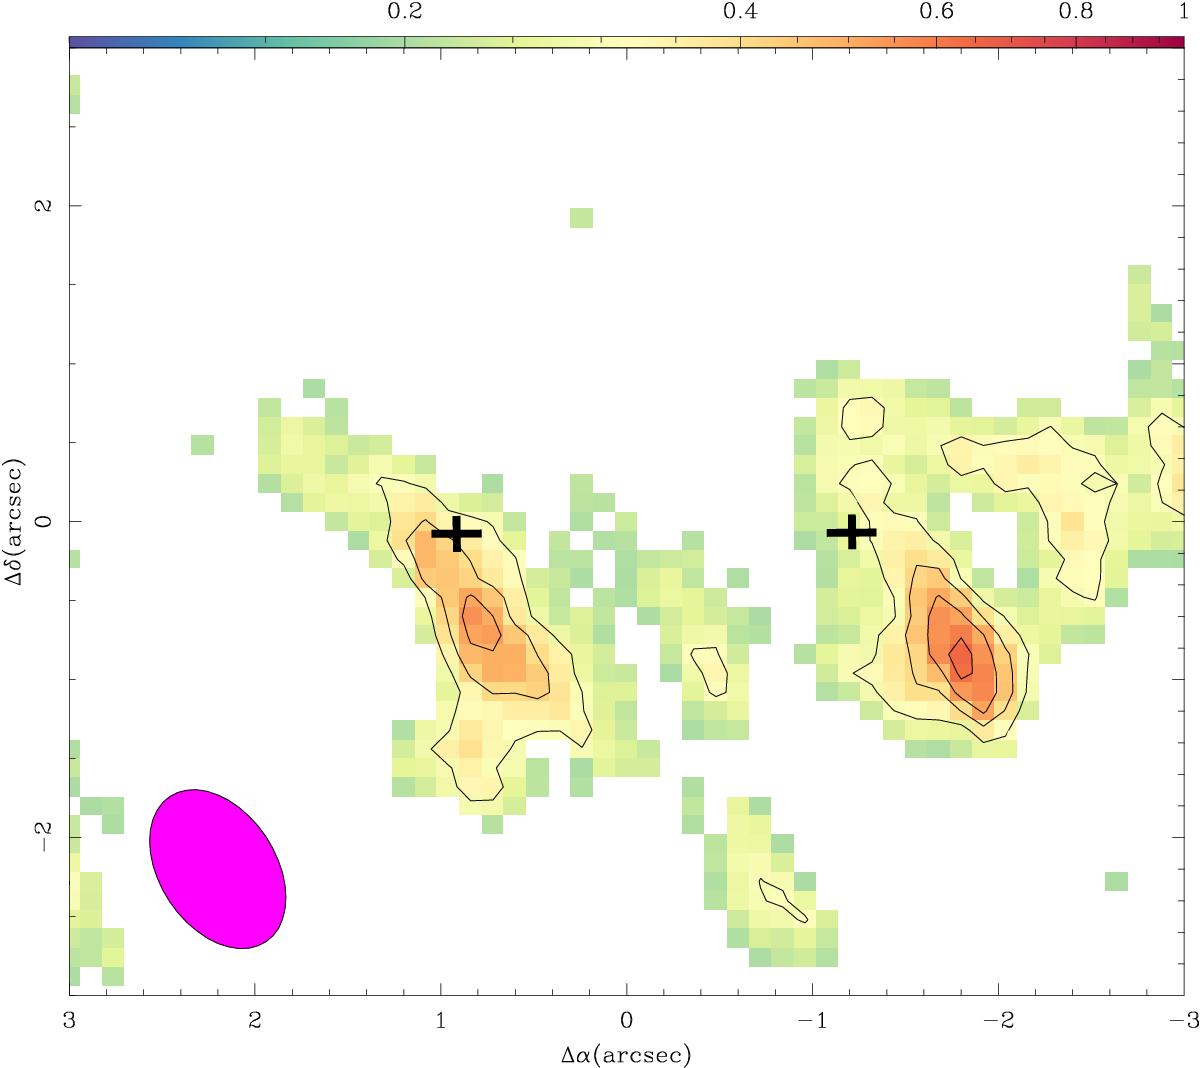
HNCO(6−5) mapover the central 6′′ × 6′′ region. Contours are from 3σ in increments of 1σ where σ ~ 0.1 Jykm s-1/beam. The black crosses indicate the approximate position of the CO(3−2) peak. The beam size is displayed in the bottom left (1![]() ), PA = 23°.
), PA = 23°.
Current usage metrics show cumulative count of Article Views (full-text article views including HTML views, PDF and ePub downloads, according to the available data) and Abstracts Views on Vision4Press platform.
Data correspond to usage on the plateform after 2015. The current usage metrics is available 48-96 hours after online publication and is updated daily on week days.
Initial download of the metrics may take a while.