Fig. 3
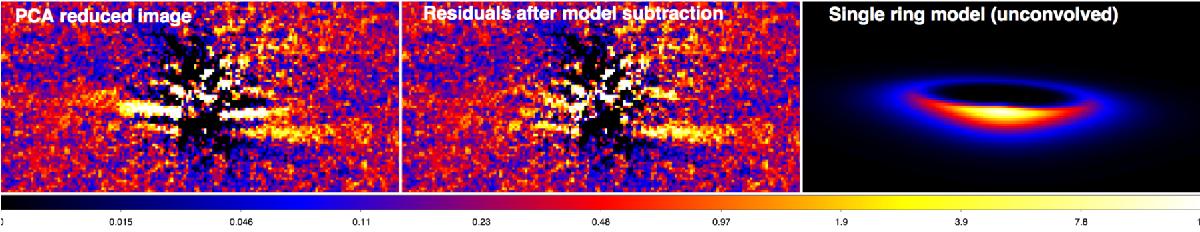
Results of the forward modeling for the case of a single belt. Left: PCA image of the disk. Middle: Residuals after subtraction of the best single ring model, with the same linear color scale as the left image. Right: best single ring model (unconvolved with the SPHERE PSF) in a log scale to show the fainter backward side of the disk.
Current usage metrics show cumulative count of Article Views (full-text article views including HTML views, PDF and ePub downloads, according to the available data) and Abstracts Views on Vision4Press platform.
Data correspond to usage on the plateform after 2015. The current usage metrics is available 48-96 hours after online publication and is updated daily on week days.
Initial download of the metrics may take a while.