Fig. 5
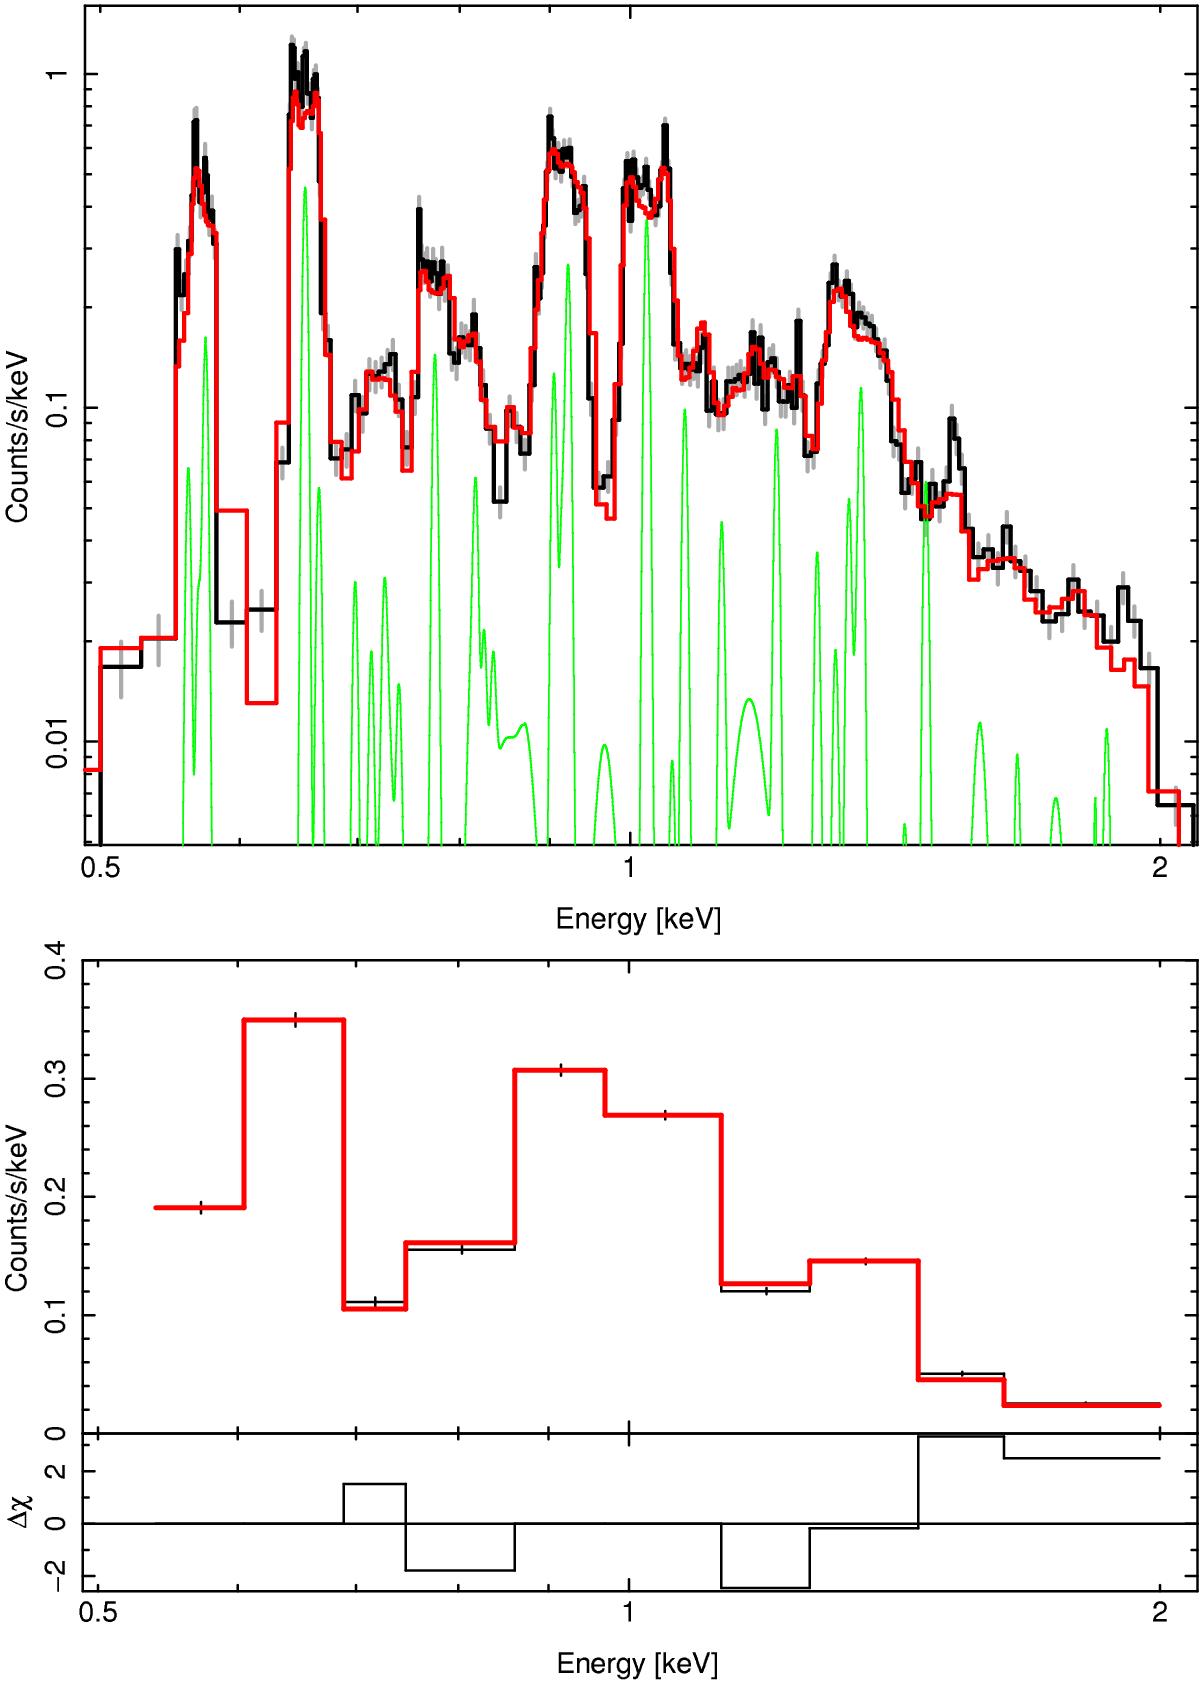
Fit to the HETG MEG−1 data. Top: the observed MEG−1 data-minus-background counts are shown in black. For reference, the IACHEC model is multiplied by the ARF and is shown in green; it has been scaled by 0.1 for clarity. The red curve shows the IACHEC model when it is further folded through an RMF that approximates the spatial extension of E0102 (see text). Bottom: the data (black) and model (red) counts are rebinned to a set of ten coarse bins which are used for the 5-parameter model fits.
Current usage metrics show cumulative count of Article Views (full-text article views including HTML views, PDF and ePub downloads, according to the available data) and Abstracts Views on Vision4Press platform.
Data correspond to usage on the plateform after 2015. The current usage metrics is available 48-96 hours after online publication and is updated daily on week days.
Initial download of the metrics may take a while.