Fig. 4
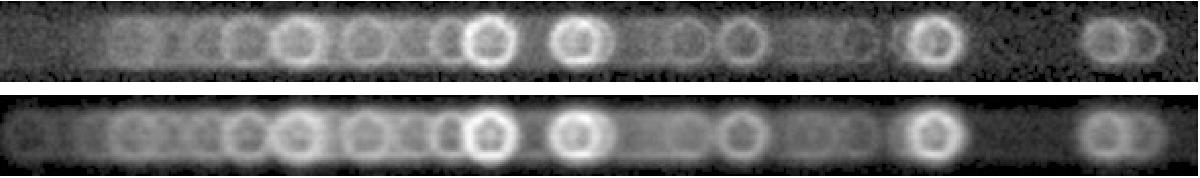
Images of the MEG-dispersed E0102 data (top) and a synthesized model (bottom). The ±1 MEG orders from all three epochs have been combined and displayed in the range from 4.6 Å to 23 Å (left-to-right, 2.7−0.54 keV). The data clearly show bright rings of line emission for many lines; the very brightest lines just left of center are from Ne x Lyα and Ne ix Heα triplet. The simulated spectral image (bottom) was created using the IACHEC standard model and does not include any background events. The cross-dispersion range for each image is ±28 arcsec.
Current usage metrics show cumulative count of Article Views (full-text article views including HTML views, PDF and ePub downloads, according to the available data) and Abstracts Views on Vision4Press platform.
Data correspond to usage on the plateform after 2015. The current usage metrics is available 48-96 hours after online publication and is updated daily on week days.
Initial download of the metrics may take a while.