Free Access
Fig. 3
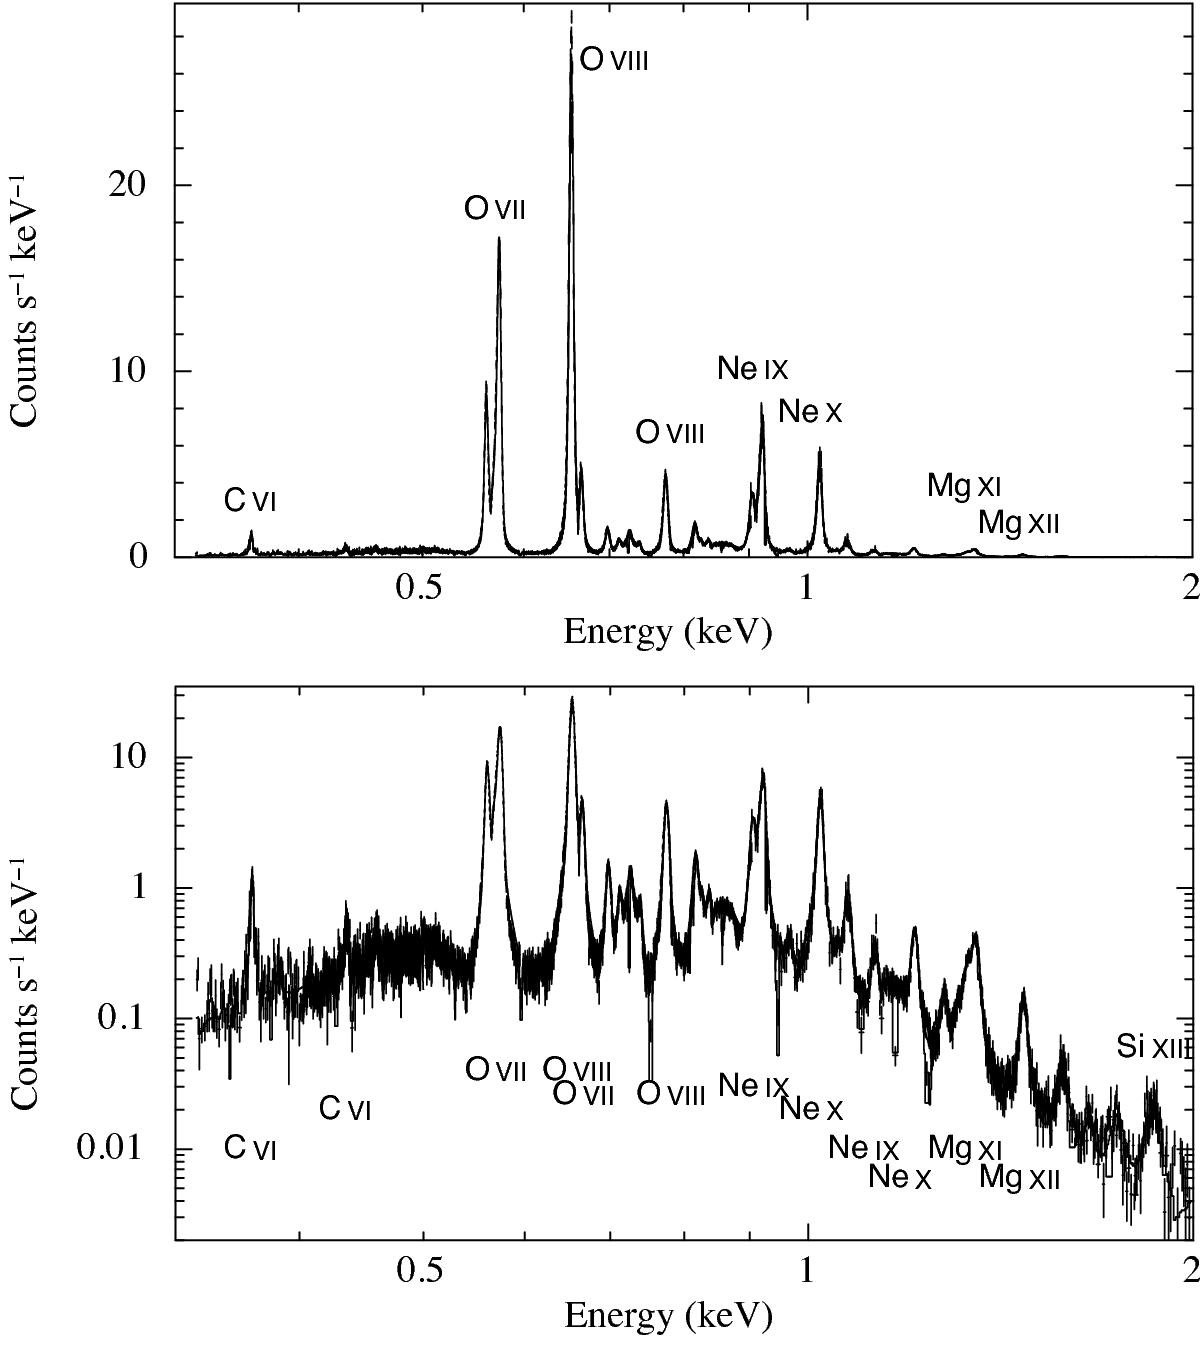
XMM-Newton RGS1/RGS2 spectrum of E0102 from a combination of 23 observations (top). The bright lines of O and Ne dominate the flux in this band. Same as top figure except with a logarithmic Y axis to emphasize the continuum and the weakest lines (bottom). Fe L emission is absent in this spectrum.
This figure is made of several images, please see below:
Current usage metrics show cumulative count of Article Views (full-text article views including HTML views, PDF and ePub downloads, according to the available data) and Abstracts Views on Vision4Press platform.
Data correspond to usage on the plateform after 2015. The current usage metrics is available 48-96 hours after online publication and is updated daily on week days.
Initial download of the metrics may take a while.