Fig. 20
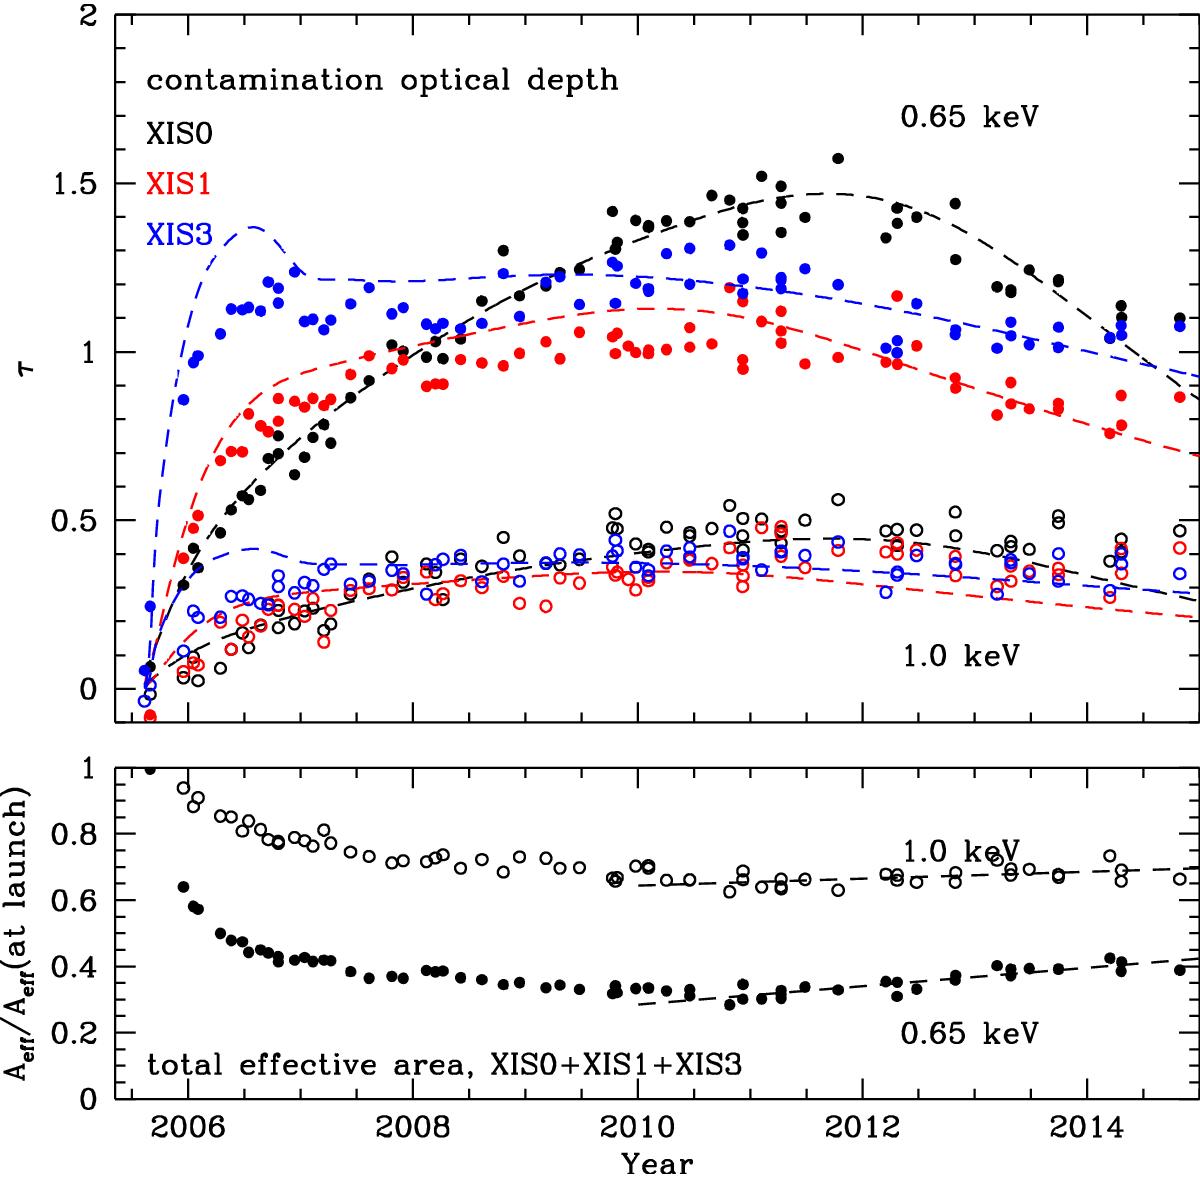
Contamination history of the Suzaku XIS. Top: the optical depth at two energies as inferred from E0102 observations (points) compared to v20140825 of the Suzaku contamination CALDB trend (dashed lines). E0102 is one of the calibration sources used to measure the on-axis contamination, although differences are seen between the inferred values and the CALDB, especially early in the mission. Bottom: relative combined effective area of the three working CCDs at two energies as measured from E0102. This assumes no contamination at the opening of the XIS doors in July 2005. The dashed lines are from a linear fit to the data after 2010, and indicate a decrease in the contaminant at later times.
Current usage metrics show cumulative count of Article Views (full-text article views including HTML views, PDF and ePub downloads, according to the available data) and Abstracts Views on Vision4Press platform.
Data correspond to usage on the plateform after 2015. The current usage metrics is available 48-96 hours after online publication and is updated daily on week days.
Initial download of the metrics may take a while.