Fig. 16
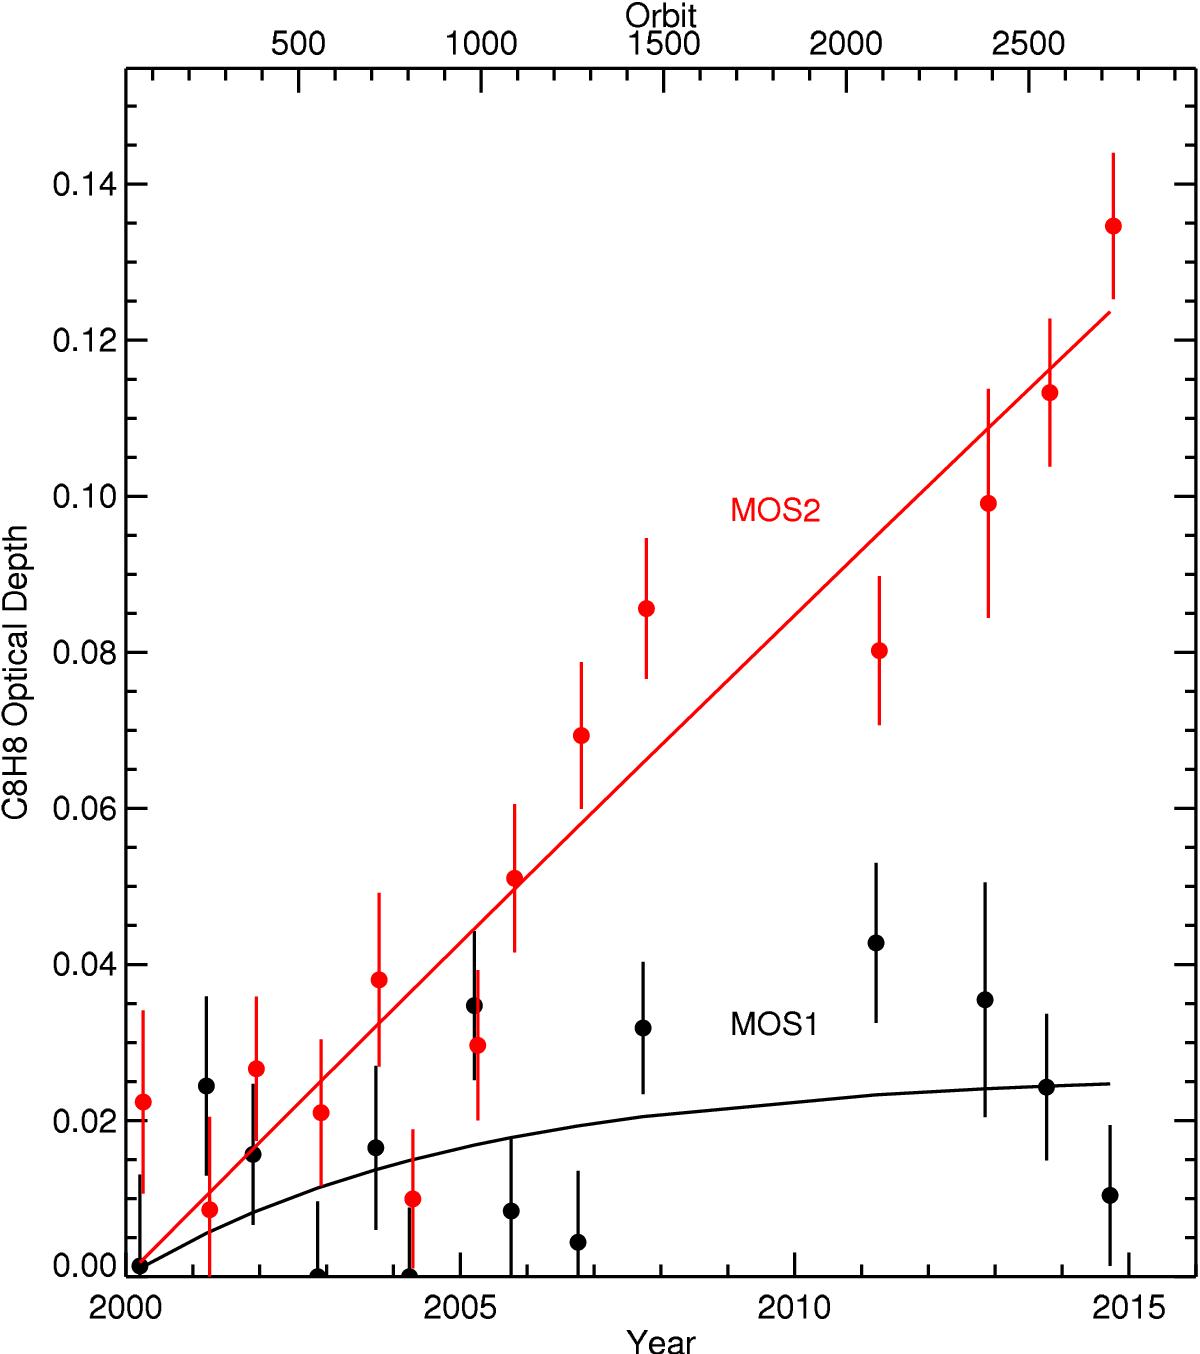
XMM-Newton EPIC-MOS contamination model as optical depth of C8H8 as a function of time. Data points are derived by finding the depth of C8H8 which minimises the best-fit parameter when fitting the standard E0102 model to the observed EPIC-MOS spectra. The solid curves represent best-fit exponential models. MOS1 is equally consistent with a fixed value of the contaminant (see text).
Current usage metrics show cumulative count of Article Views (full-text article views including HTML views, PDF and ePub downloads, according to the available data) and Abstracts Views on Vision4Press platform.
Data correspond to usage on the plateform after 2015. The current usage metrics is available 48-96 hours after online publication and is updated daily on week days.
Initial download of the metrics may take a while.