Fig. 15
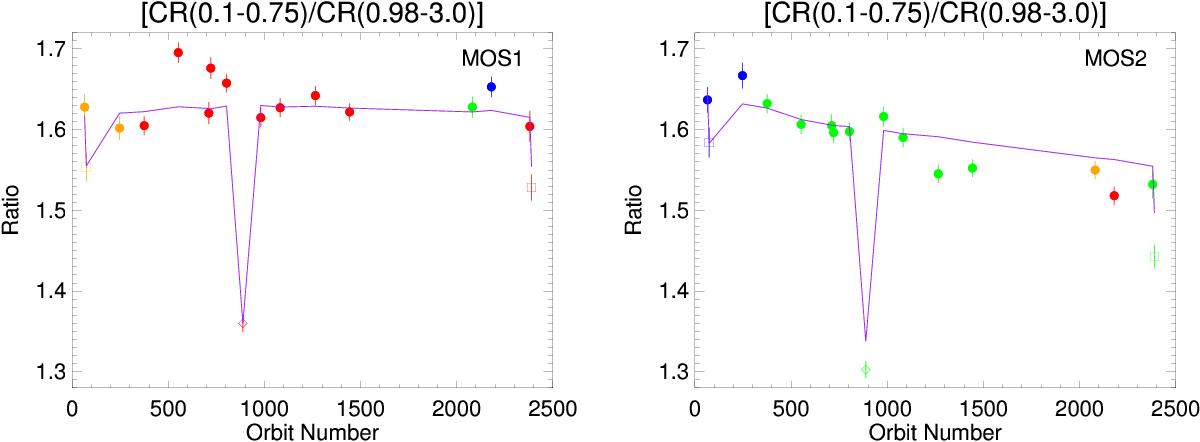
Observed (0.1−0.75)/(0.98−3.0) keV count rate ratio as a function of the Orbit number. Left panel: MOS1, right panel: MOS2. Data points are color-coded to reflect the position of the source on the detector relative to the boresight as viewed on the image plane in detector coordinates: blue (above boresight), orange (to the right), green (below) and red (to the left). All observations are thin filter with the exception of two medium filter (Orbit 0065 and 2380, squares) and one thick filter (Orbit 0888, diamond). The solid line on each plot is the predicted ratio derived by folding the standard spectral model through the EPIC-MOS response modified by a contamination model as described in the text.
Current usage metrics show cumulative count of Article Views (full-text article views including HTML views, PDF and ePub downloads, according to the available data) and Abstracts Views on Vision4Press platform.
Data correspond to usage on the plateform after 2015. The current usage metrics is available 48-96 hours after online publication and is updated daily on week days.
Initial download of the metrics may take a while.