Free Access
Fig. 11
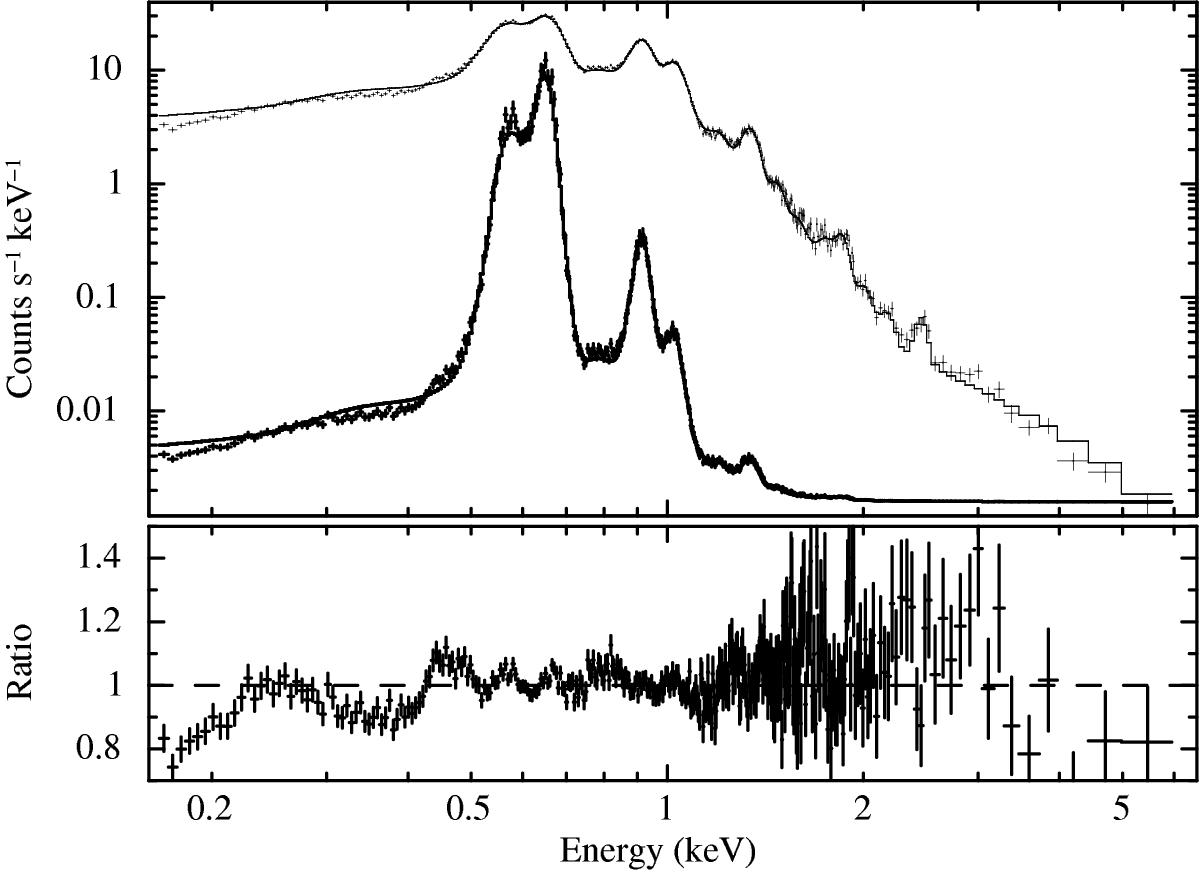
XMM-Newton EPIC-pn spectrum from OBSID 0412980301. The second (lower) curve shows the same data but with a linear axis which has been shifted downwards for clarity. Note the high count rate and the pattern in the residuals which might indicate an issue with the spectral redistribution function.
Current usage metrics show cumulative count of Article Views (full-text article views including HTML views, PDF and ePub downloads, according to the available data) and Abstracts Views on Vision4Press platform.
Data correspond to usage on the plateform after 2015. The current usage metrics is available 48-96 hours after online publication and is updated daily on week days.
Initial download of the metrics may take a while.