Free Access
Fig. 1
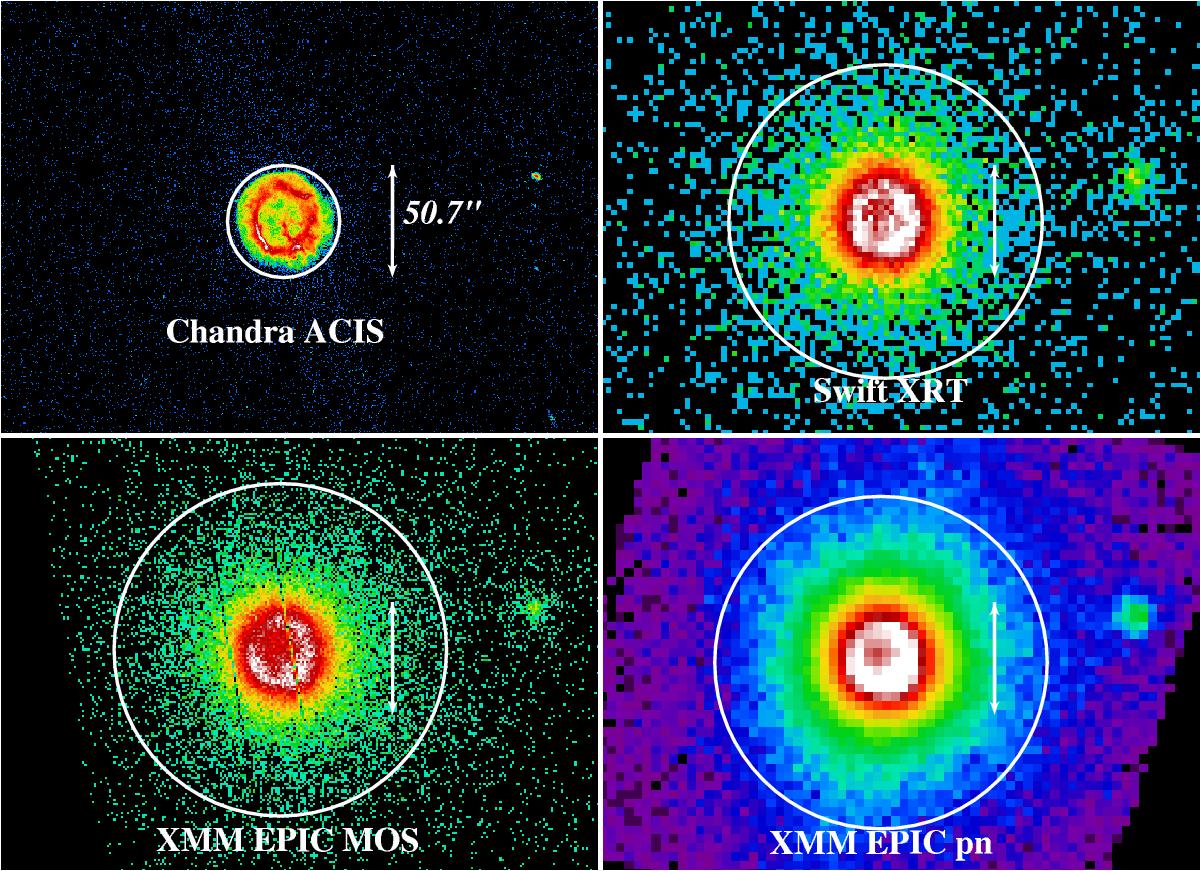
Images of E0102 from ACIS-S3 (top left), EPIC-MOS (bottom left), XRT (top right), EPIC-pn (bottom right). The white circles indicate the extraction regions used for the spectral analysis. The fine structure in E0102 is evident in the Chandra image. Note that the Chandra extraction region is the smallest.
Current usage metrics show cumulative count of Article Views (full-text article views including HTML views, PDF and ePub downloads, according to the available data) and Abstracts Views on Vision4Press platform.
Data correspond to usage on the plateform after 2015. The current usage metrics is available 48-96 hours after online publication and is updated daily on week days.
Initial download of the metrics may take a while.