Free Access
Fig. 1
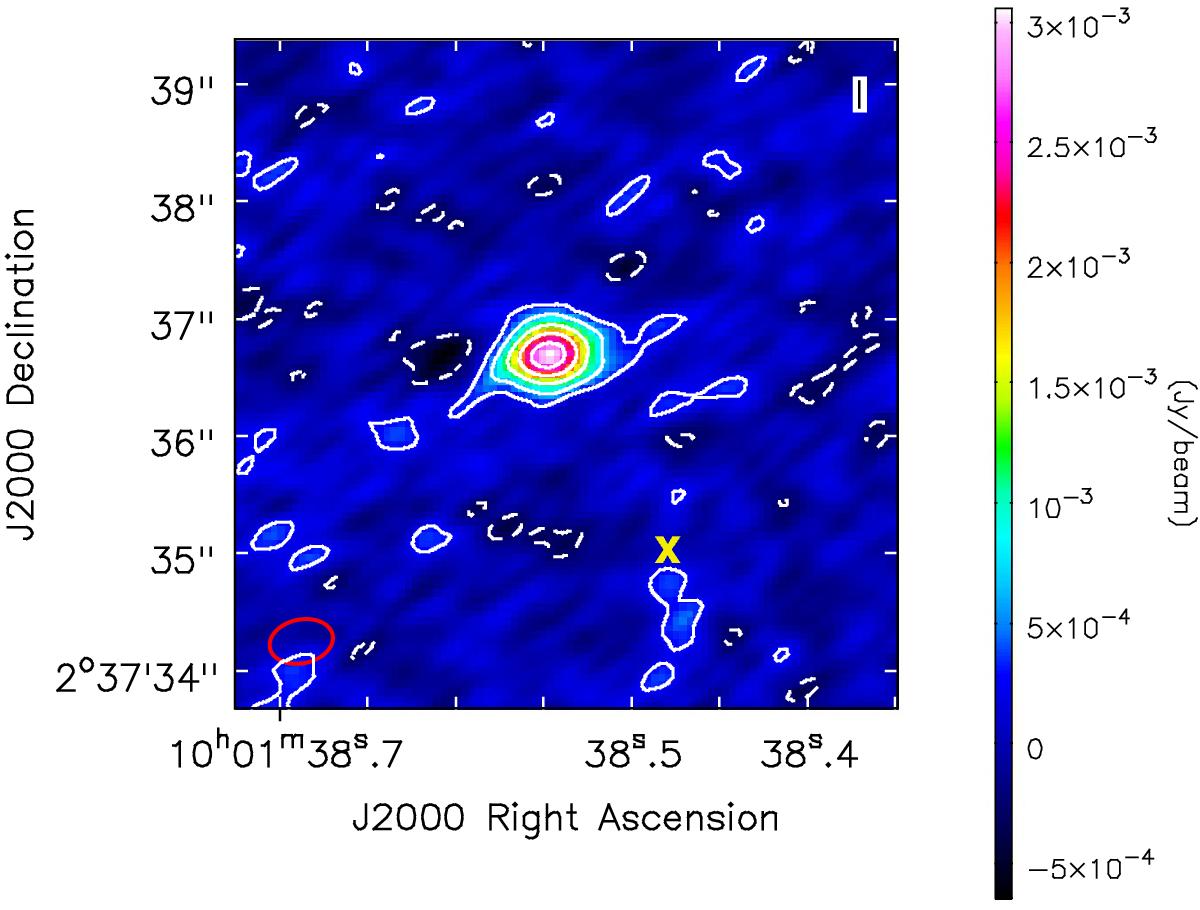
Continuum in ALMA Band 7 averaged over the four spectral windows. Solid lines show the 2, 5, 10, 15, and 20σ contours, while dashed lines show negative fluctuations at − 2σ. The beam is shown by the red ellipse in the bottom left corner. The yellow “X” shows the position of the optically detected galaxy.
Current usage metrics show cumulative count of Article Views (full-text article views including HTML views, PDF and ePub downloads, according to the available data) and Abstracts Views on Vision4Press platform.
Data correspond to usage on the plateform after 2015. The current usage metrics is available 48-96 hours after online publication and is updated daily on week days.
Initial download of the metrics may take a while.