Fig. 19
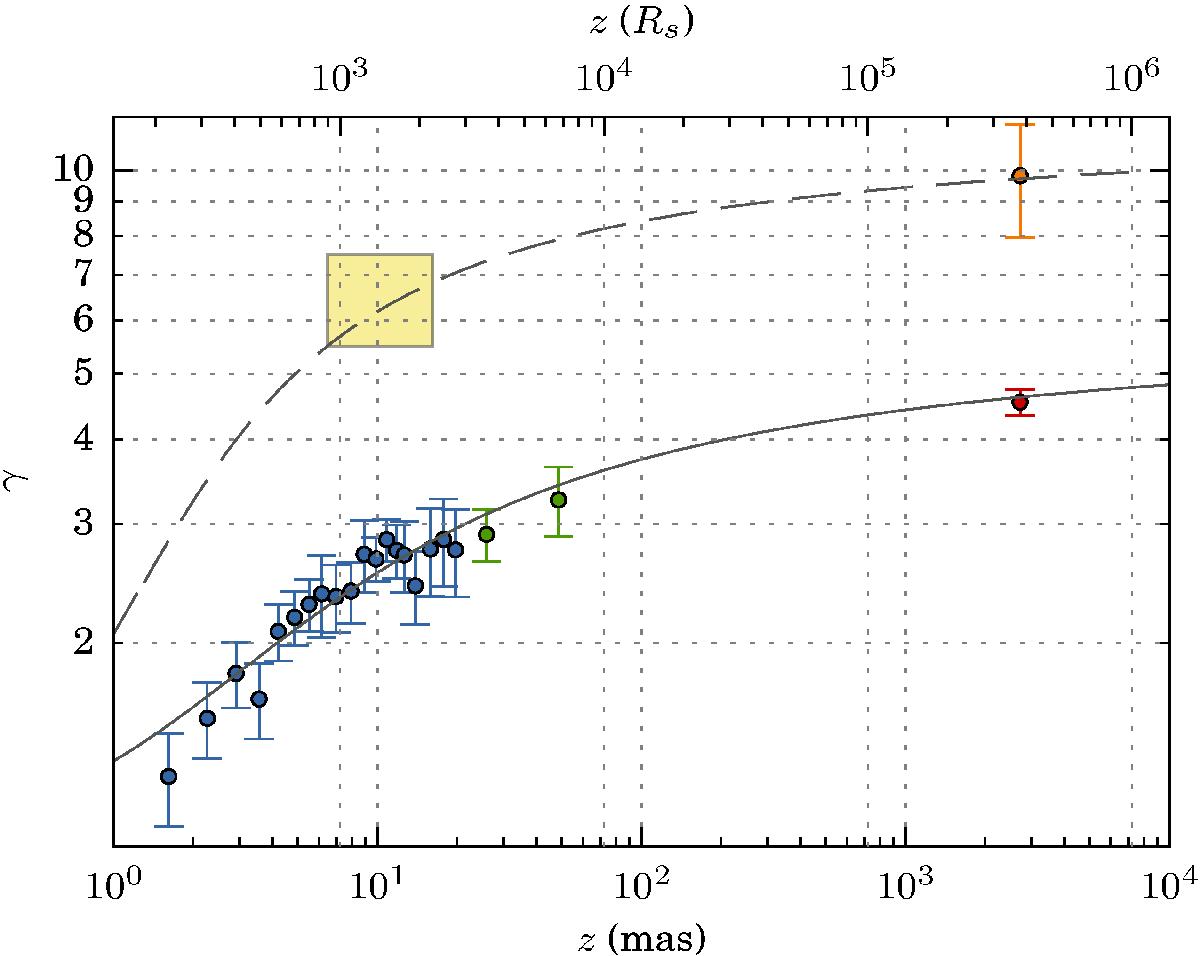
Wind solution for the spine (dashed line) and the sheath (solid line). The solution for the spine fits well the inferred velocity of the deboosted structure observed in the 43 GHz VLBA maps (yellow box) and the velocity observed at HST-1 in the optical band (orange point). The solution for the sheath fits the fast velocities measured in the 43 GHz (blue points) and 15 GHz (green points) VLBA data, and at HST-1 in the radio band (red point). The 15 GHz VLBA data points are binned averages of the fastest observed apparent velocities from our WISE analysis.
Current usage metrics show cumulative count of Article Views (full-text article views including HTML views, PDF and ePub downloads, according to the available data) and Abstracts Views on Vision4Press platform.
Data correspond to usage on the plateform after 2015. The current usage metrics is available 48-96 hours after online publication and is updated daily on week days.
Initial download of the metrics may take a while.