Fig. 18
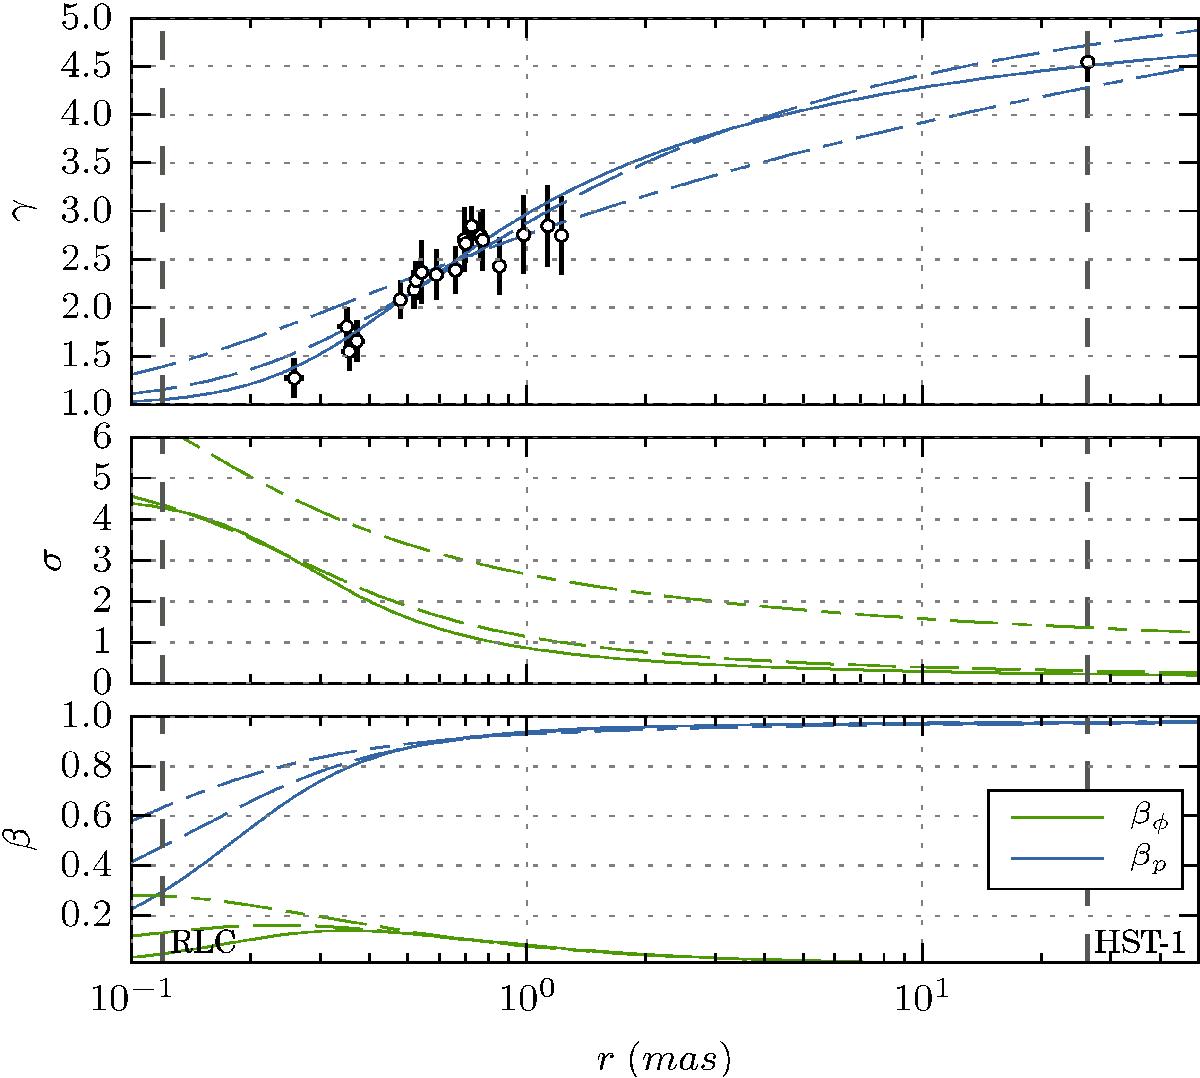
Wind solution for model 1 (solid line), model 2 (dashed line) and model 3 (long dash short dash line) for the flux function that best reproduces the observed acceleration (black points). The upper and middle panels show the total energy (blue) and magnetisation parameter (green). The lower panel shows the toroidal (green) and poloidal (blue) velocity.
Current usage metrics show cumulative count of Article Views (full-text article views including HTML views, PDF and ePub downloads, according to the available data) and Abstracts Views on Vision4Press platform.
Data correspond to usage on the plateform after 2015. The current usage metrics is available 48-96 hours after online publication and is updated daily on week days.
Initial download of the metrics may take a while.