Fig. 15
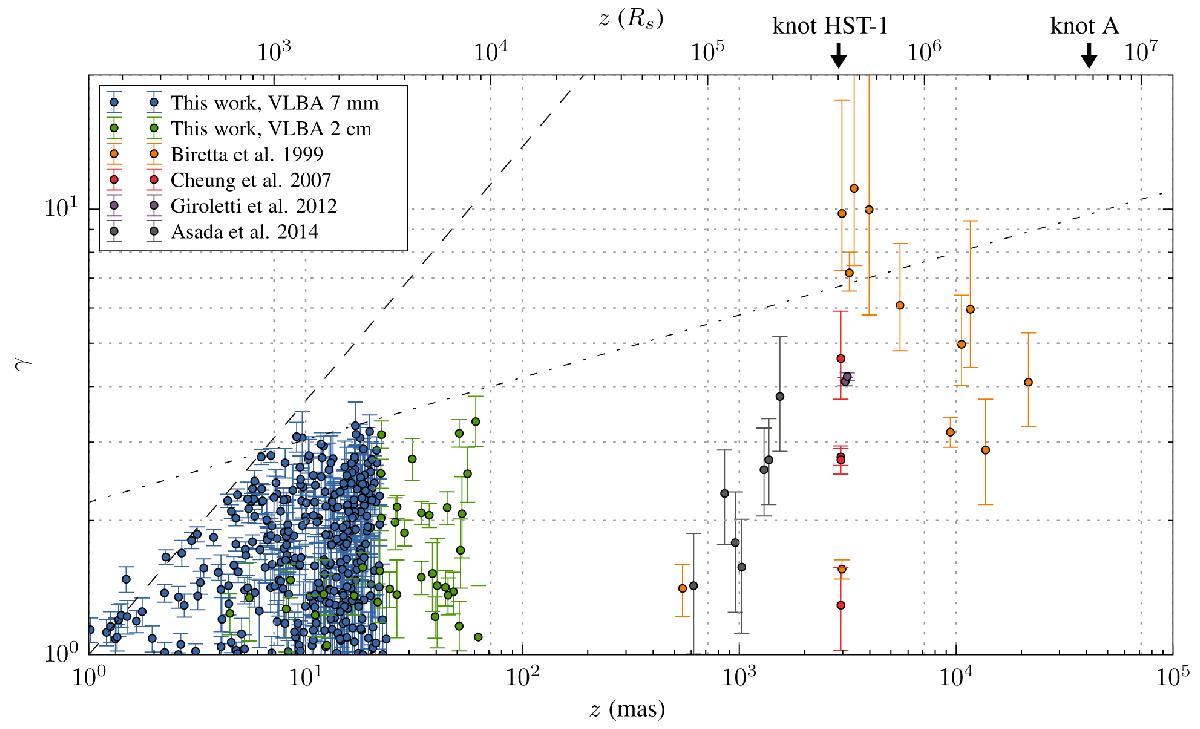
Acceleration profile of the jet in M 87. We plot the Lorentz factor measured from WISE analysis of VLBA images at 7 mm (blue), 2 cm (green), from Cheung et al. (2007) using VLBA at 1.7 GHz (red), from Giroletti et al. (2012) and Asada et al. (2014) using EVN at 1.7 GHz (magenta and gray respectively), and from optical images using HST (Biretta et al. 1999; orange). The Lorentz factor and de-projected z axis are computed assuming θ = 18° (z ~ 3.2 zobs). Two regimes are found with a linear acceleration up to z ~ 103Rs, followed by a slow acceleration up to HST-1
Current usage metrics show cumulative count of Article Views (full-text article views including HTML views, PDF and ePub downloads, according to the available data) and Abstracts Views on Vision4Press platform.
Data correspond to usage on the plateform after 2015. The current usage metrics is available 48-96 hours after online publication and is updated daily on week days.
Initial download of the metrics may take a while.