Fig. 3
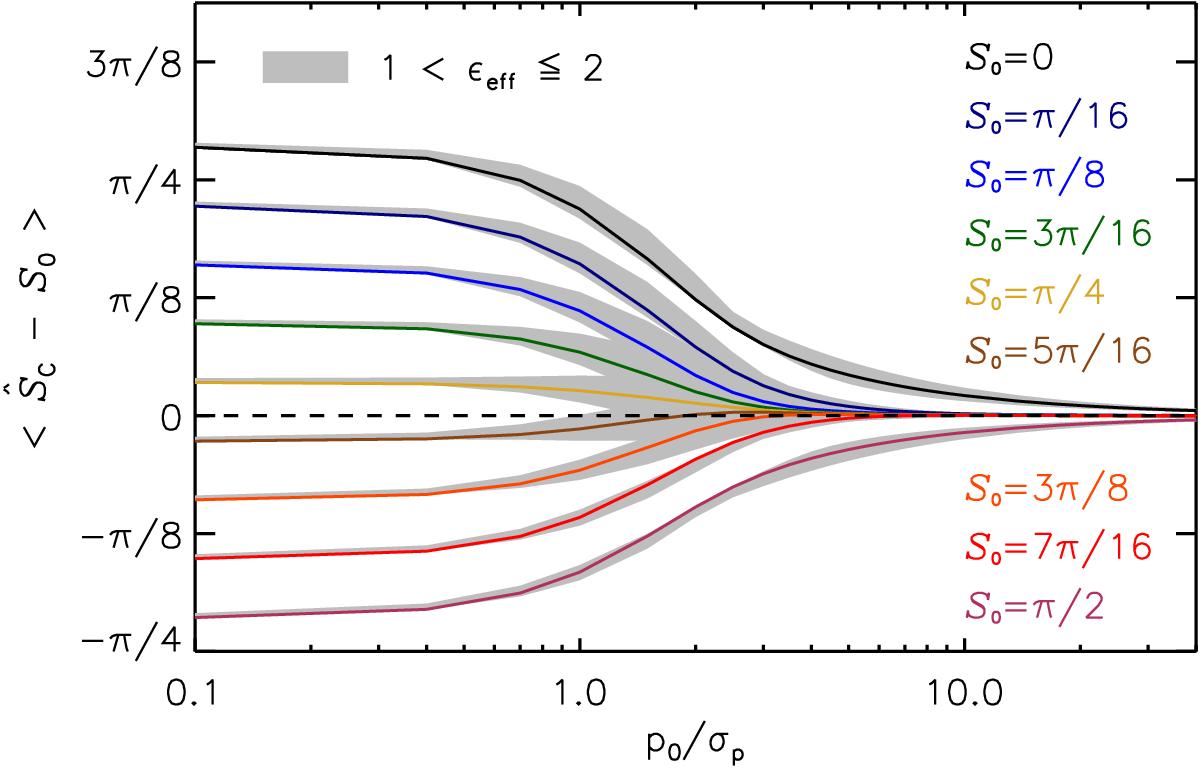
Average bias on 106 MC noise realizations for the conventional estimator ![]() for different true values
for different true values ![]() as a function of S/N: in the canonical case of the noise covariance matrix configuration (εeff = 1) − colored plain curves and in the extreme regime (εeff up to 2). The colored curves are shown from top to bottom in the same order as the legend lines on the right part of the figure. The low regime regions are invisible at the current plot scale and coincides with colored curves. The dashed line represents the “zero bias” level.
as a function of S/N: in the canonical case of the noise covariance matrix configuration (εeff = 1) − colored plain curves and in the extreme regime (εeff up to 2). The colored curves are shown from top to bottom in the same order as the legend lines on the right part of the figure. The low regime regions are invisible at the current plot scale and coincides with colored curves. The dashed line represents the “zero bias” level.
Current usage metrics show cumulative count of Article Views (full-text article views including HTML views, PDF and ePub downloads, according to the available data) and Abstracts Views on Vision4Press platform.
Data correspond to usage on the plateform after 2015. The current usage metrics is available 48-96 hours after online publication and is updated daily on week days.
Initial download of the metrics may take a while.