Open Access
Fig. 1
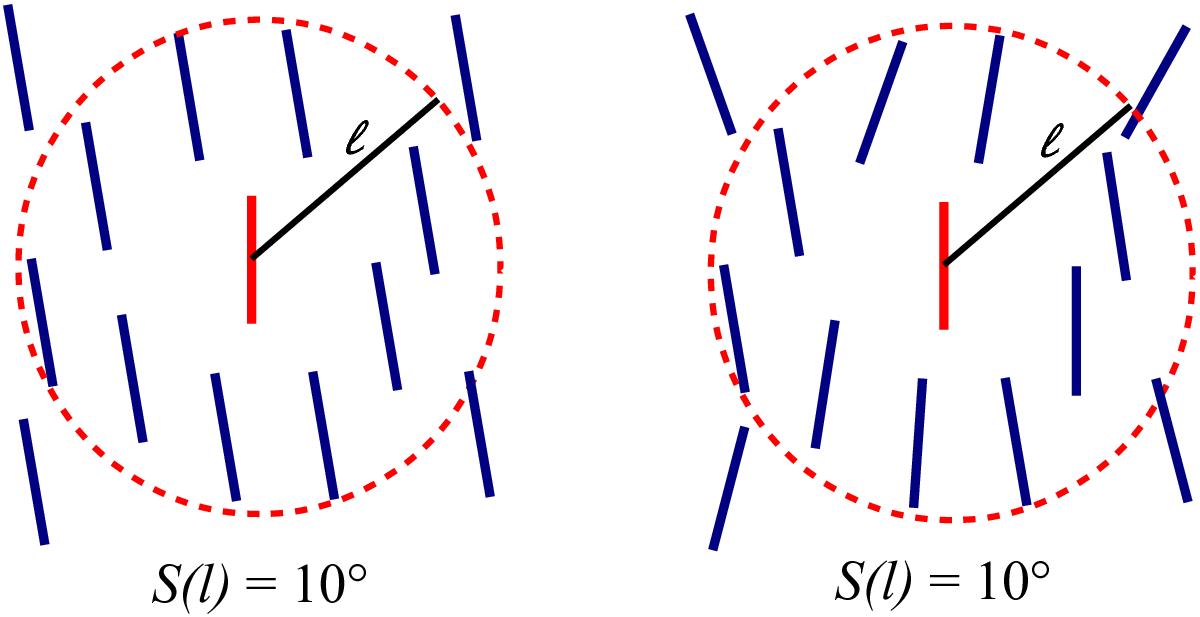
Schematic view of the simulated configuration of polarization orientations. The polarization angle dispersion function is calculated at the position of the red line segment within the red-dotted circle of radius l. Left: uniform configuration. Right: random configuration. Both cases give ![]() .
.
Current usage metrics show cumulative count of Article Views (full-text article views including HTML views, PDF and ePub downloads, according to the available data) and Abstracts Views on Vision4Press platform.
Data correspond to usage on the plateform after 2015. The current usage metrics is available 48-96 hours after online publication and is updated daily on week days.
Initial download of the metrics may take a while.