Fig. 8
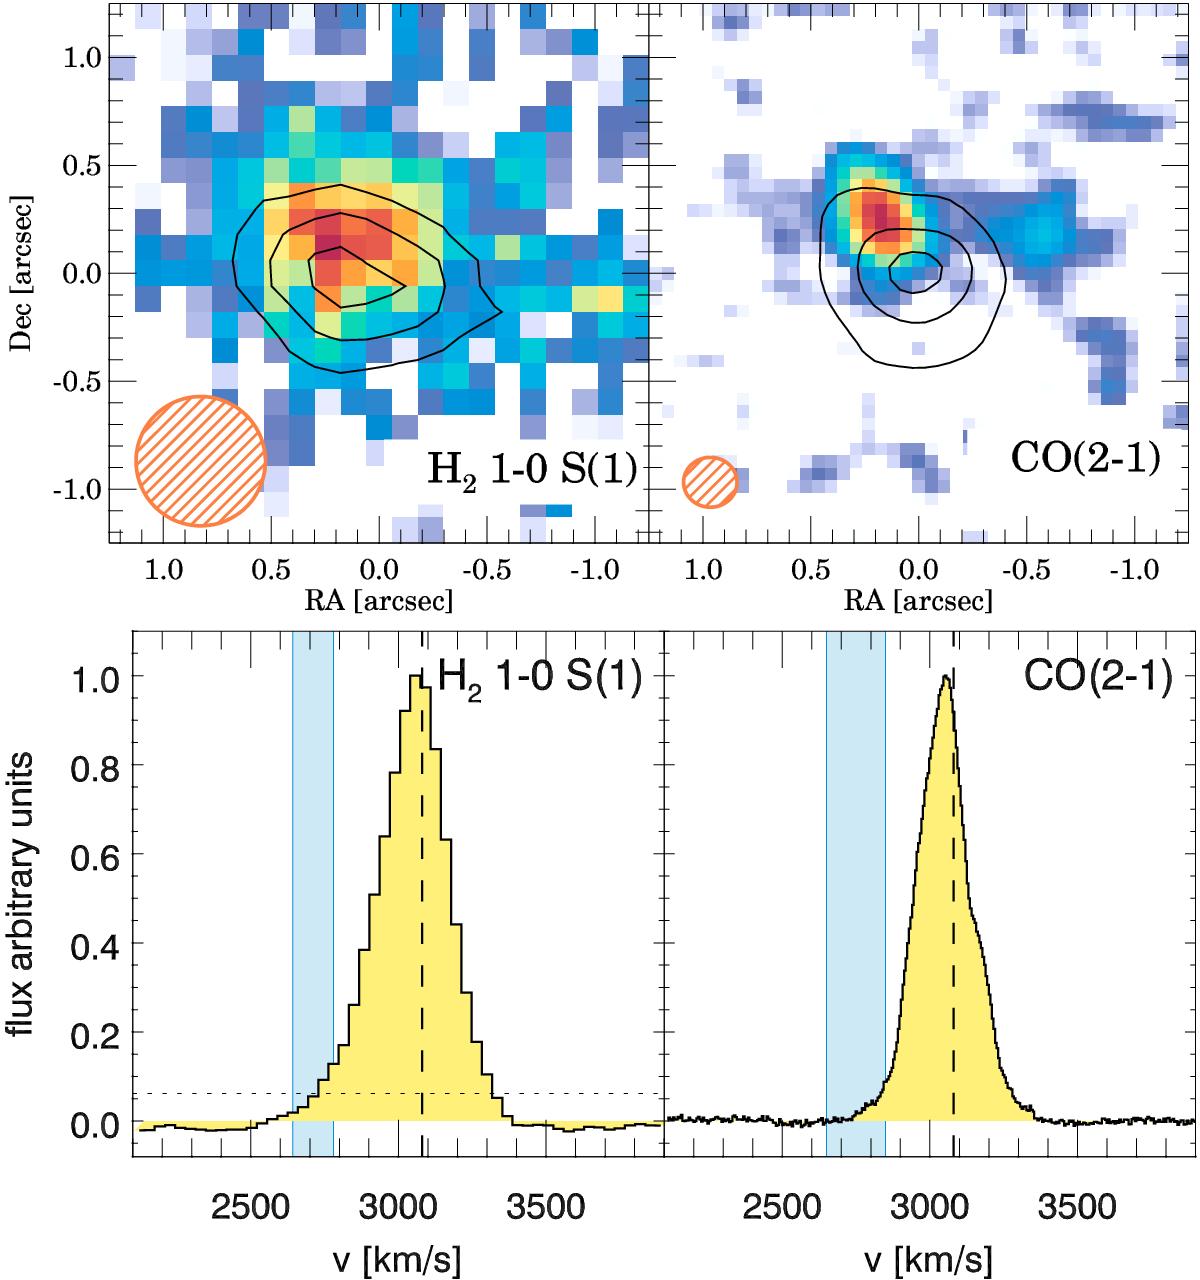
Comparison between the hot (left) and cold (right) molecular gas phases of the outflow region D. The hot molecular gas is traced by the H2 1−0 S(1) 2.12 μm transition observed with SINFONI, while the cold molecular gas is traced by CO(2−1). The background images are the integrated emission in the channels shaded in the bottom panels. The contours represent the total emission of the corresponding transition at peak ×0.9, ×0.6, and ×0.3 levels. The orange hatched circles represent the FWHM of the beam of each image (0.̋6 and ~0.̋25, respectively). The bottom panels are the spectra extracted from the regions located to the NE of the nucleus in the top panels.
Current usage metrics show cumulative count of Article Views (full-text article views including HTML views, PDF and ePub downloads, according to the available data) and Abstracts Views on Vision4Press platform.
Data correspond to usage on the plateform after 2015. The current usage metrics is available 48-96 hours after online publication and is updated daily on week days.
Initial download of the metrics may take a while.