Fig. 1
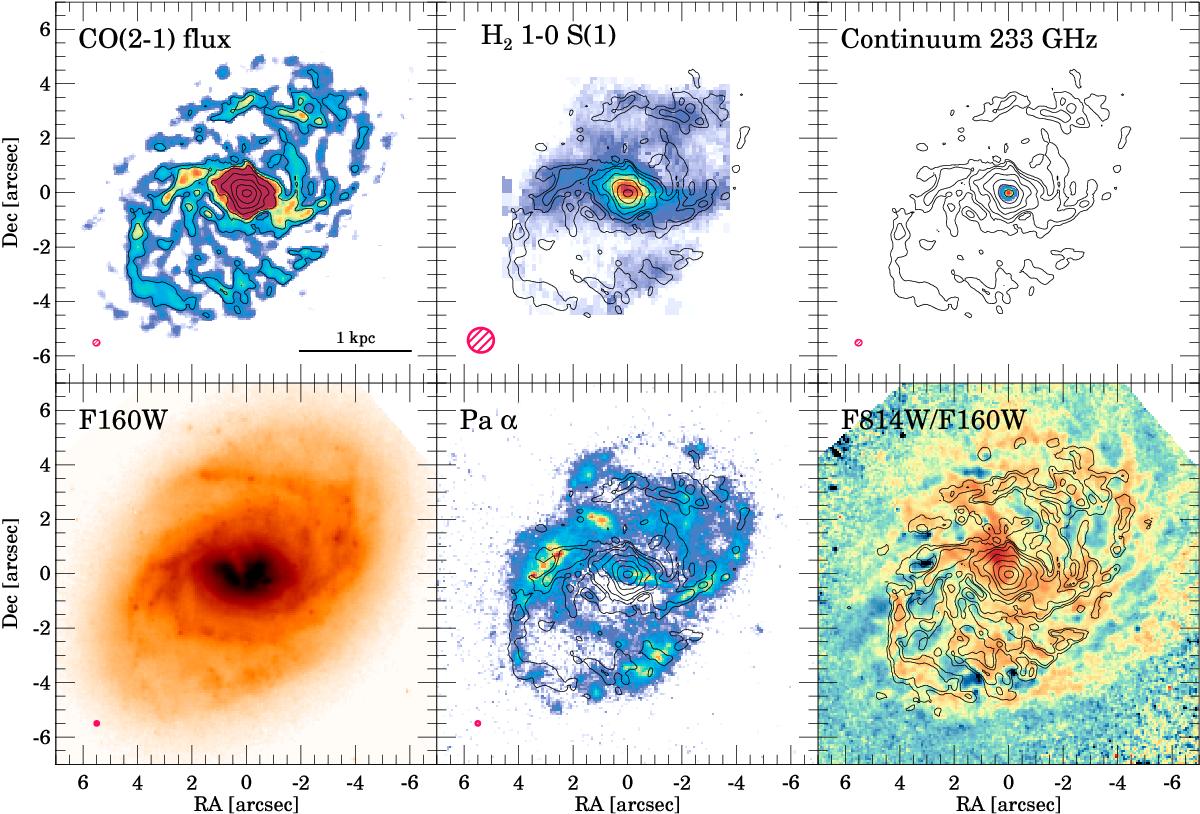
Top row: ALMA 12CO(2−1), VLT/SINFONI H2 1−0 S(1) 2.12 μm, and ALMA 233 GHz continuum (rest frequency) maps of ESO 320-G030. The contours in all the images correspond to the CO(2−1) emission in logarithmic steps (1, 2, 4, 8, 16, 32, 64) × 0.43 Jy km s-1 beam-1. Lower panels: HST/NICMOS F160W and continuum subtracted Paα maps and the HST F814W to F160W ratio to highlight obscured regions (red colors indicate more obscured regions). In the last panel we added an extra contour level at 0.5 × 0.43 Jy km s-1 beam-1. The red hatched ellipses indicate the beam size of each image. For the ALMA CO(2−1) and the 233 GHz continuum images, the beam size is 0.̋25 × 0.̋23, PA 89°. For the SINFONI H2 1−0 S(1) image, the beam FWHM is 0.̋6, and for the HST/NICMOS data, the beam is ~0.̋15.
Current usage metrics show cumulative count of Article Views (full-text article views including HTML views, PDF and ePub downloads, according to the available data) and Abstracts Views on Vision4Press platform.
Data correspond to usage on the plateform after 2015. The current usage metrics is available 48-96 hours after online publication and is updated daily on week days.
Initial download of the metrics may take a while.