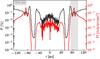
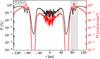
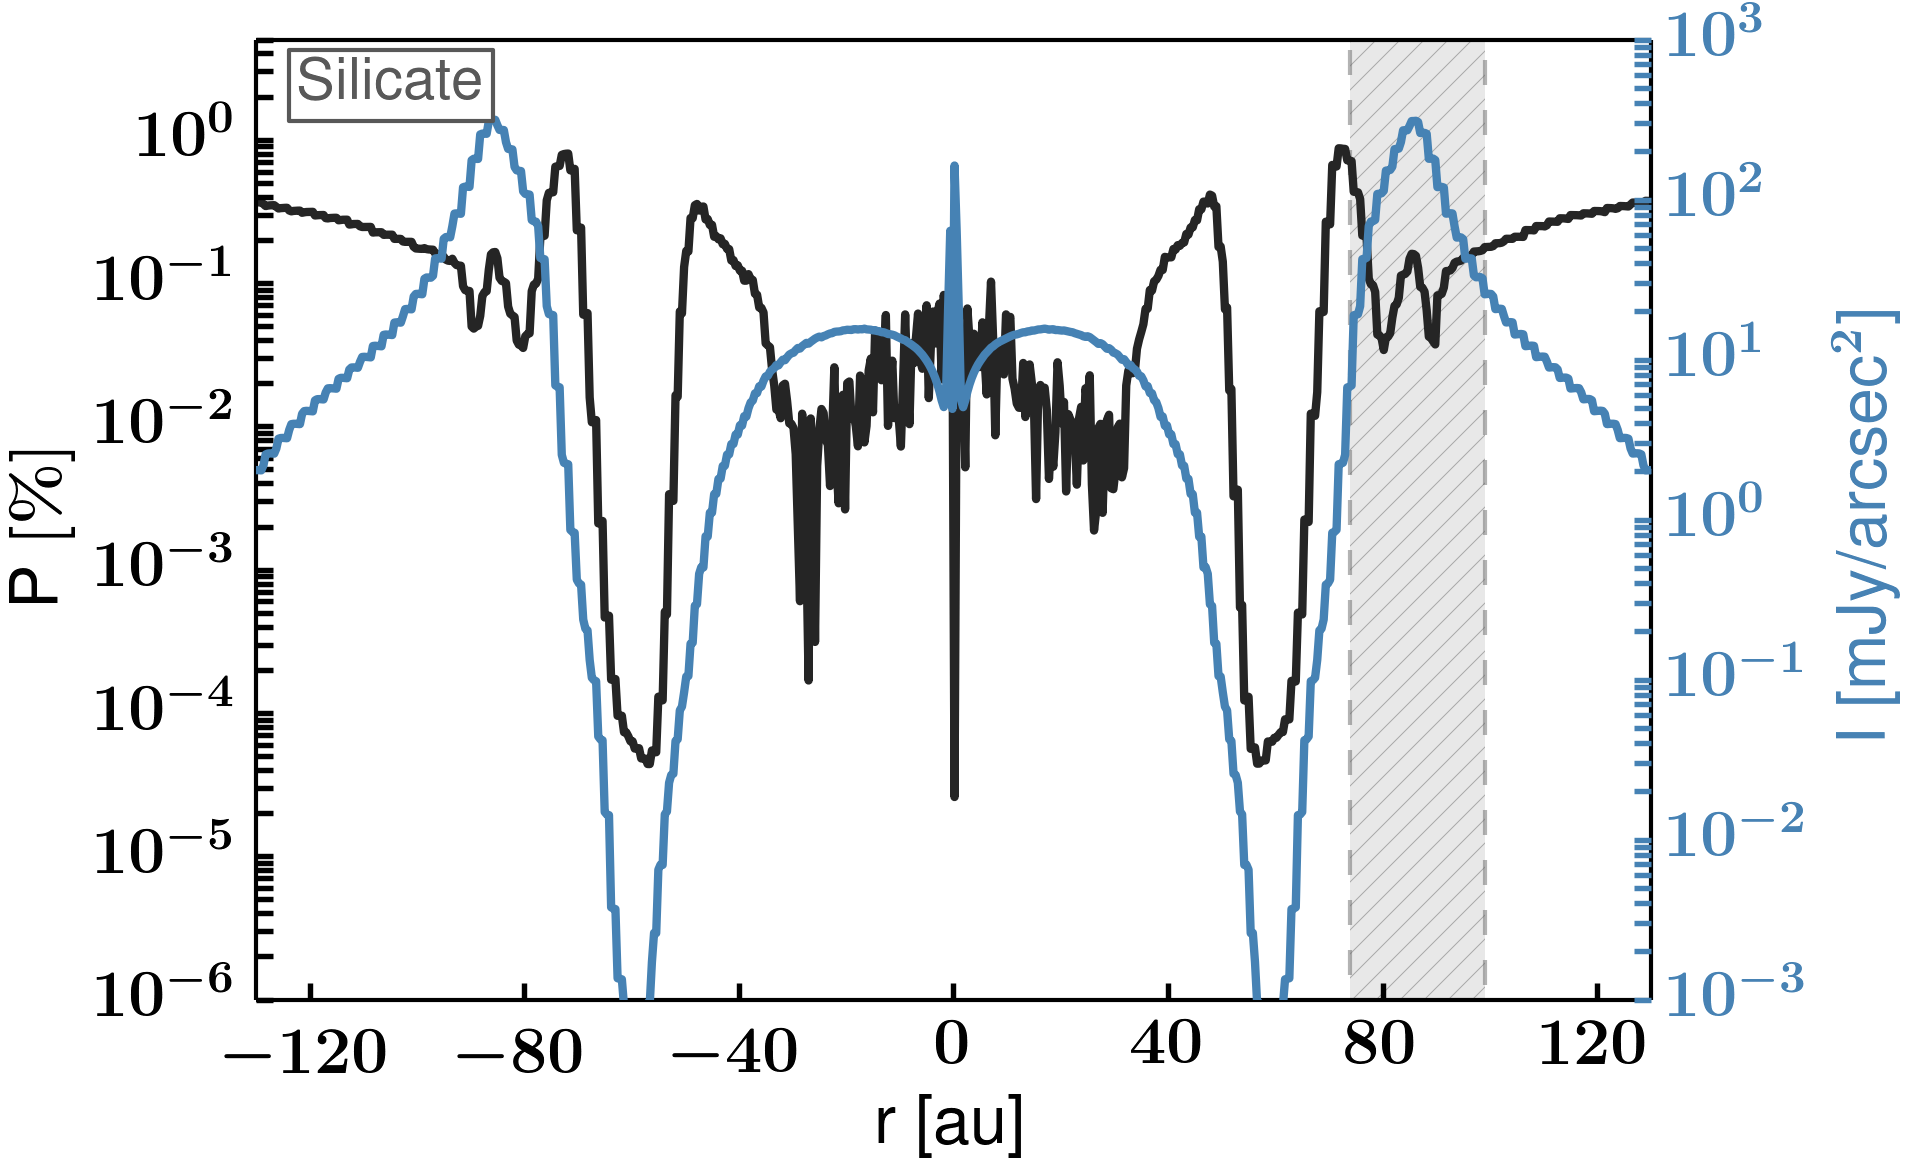
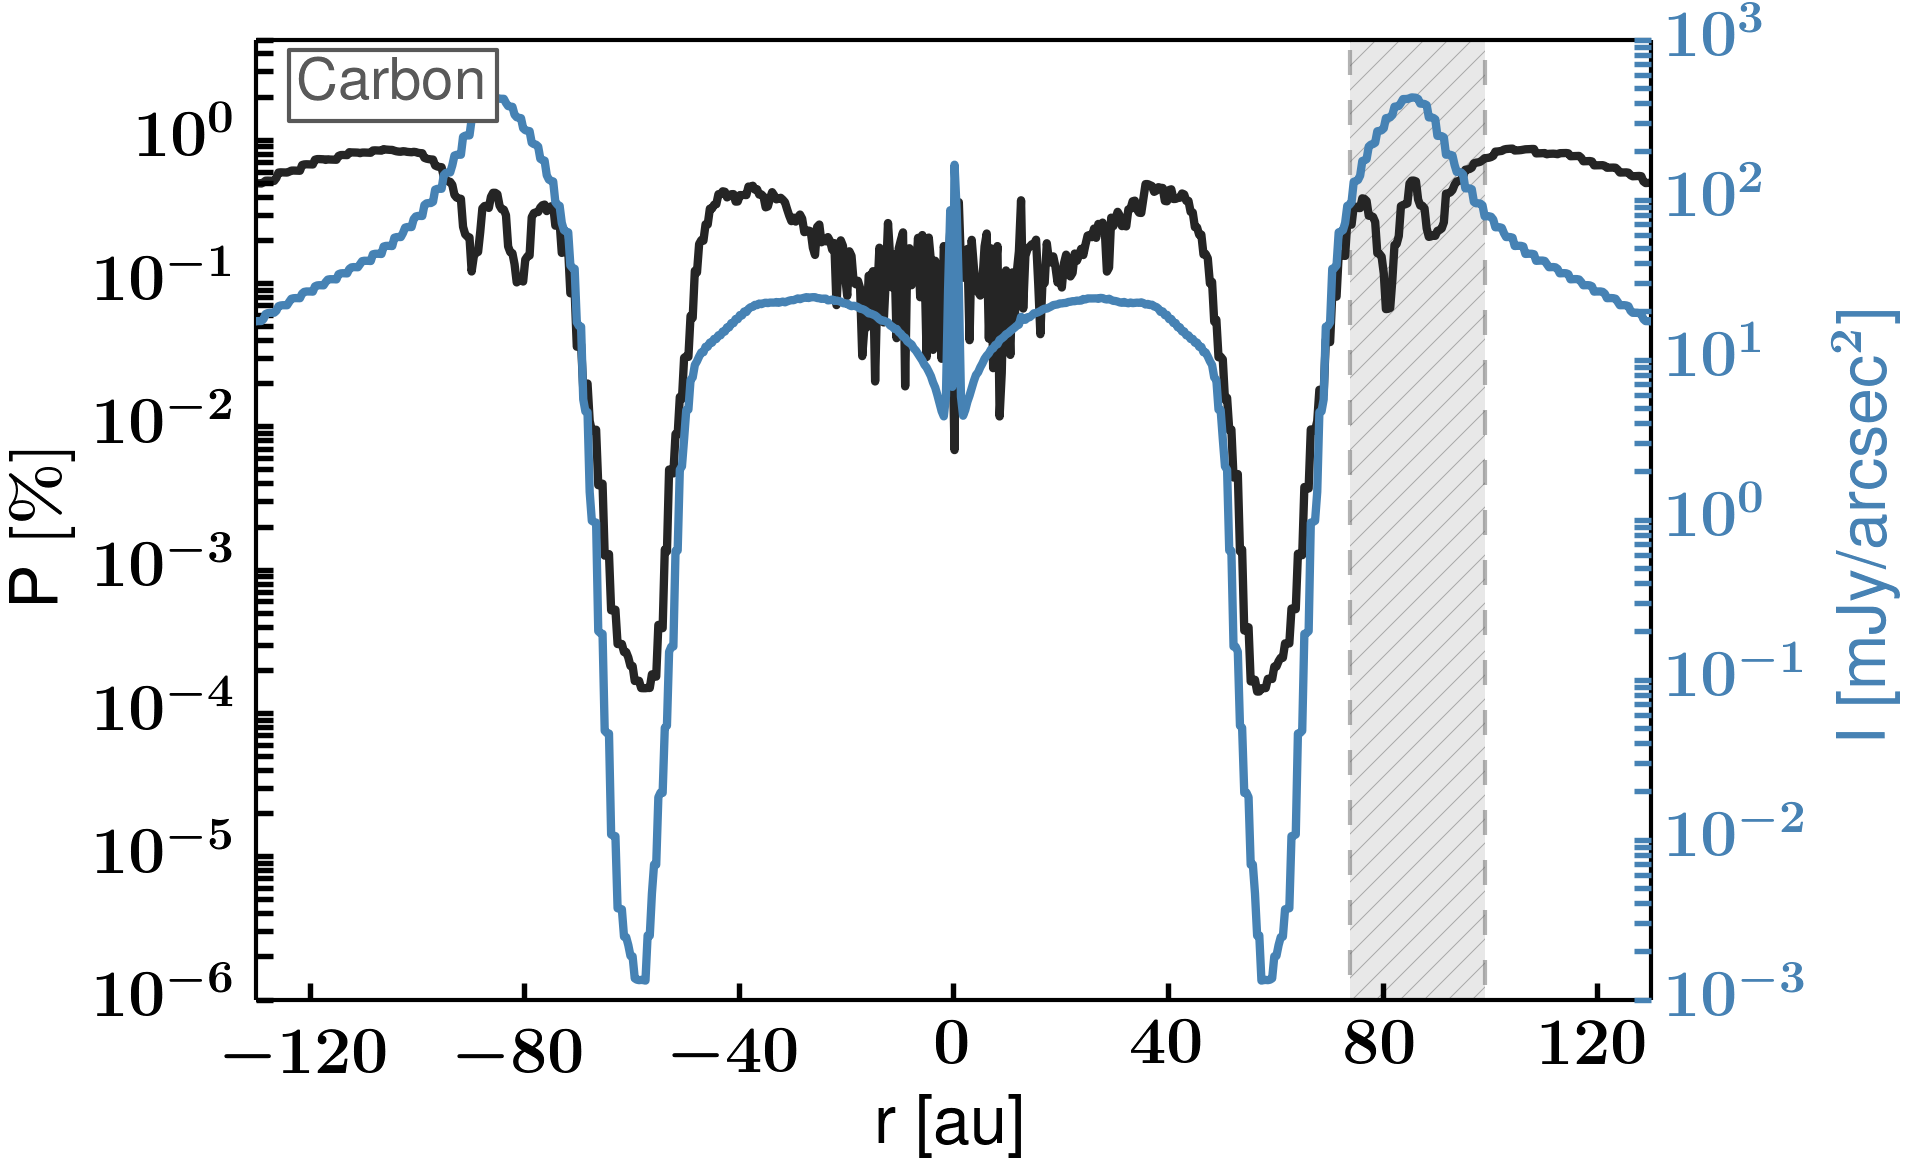
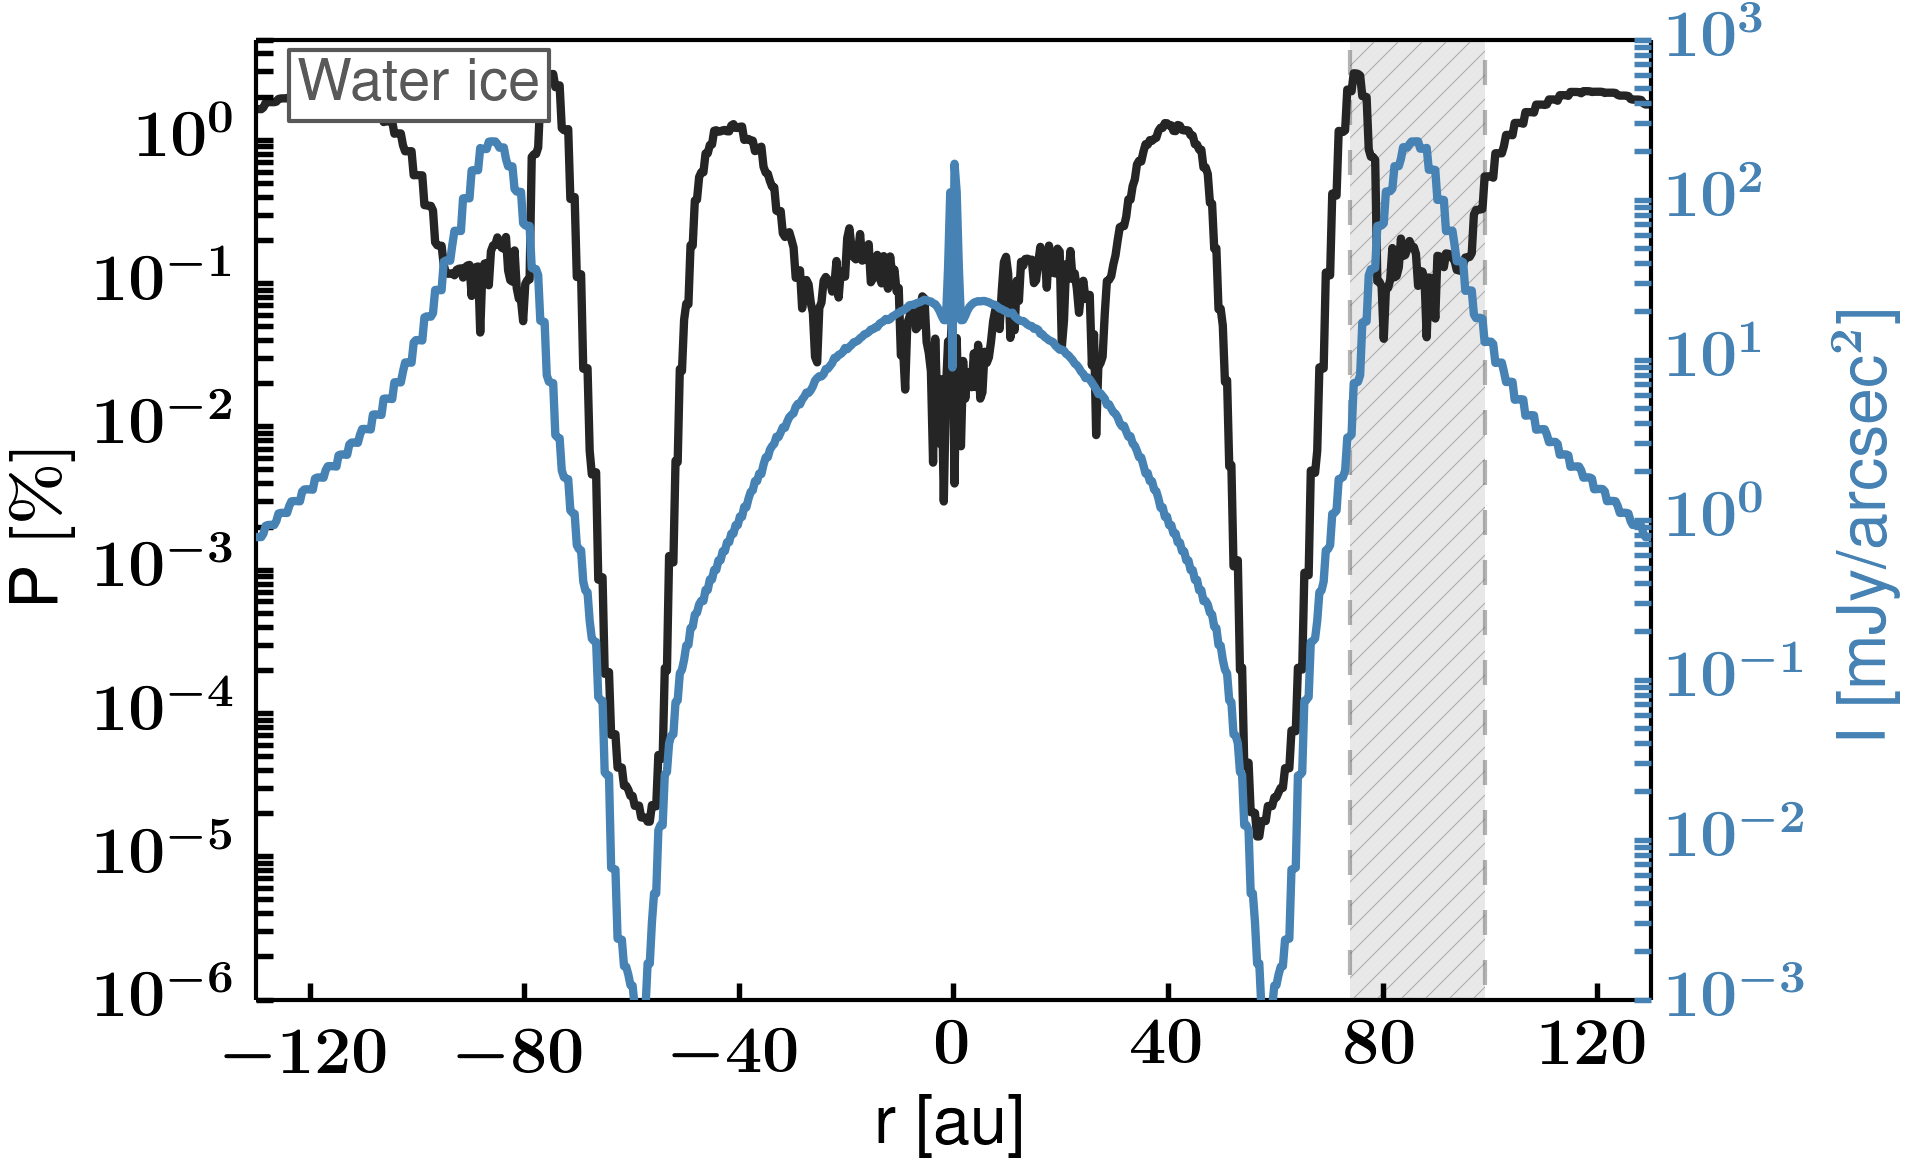
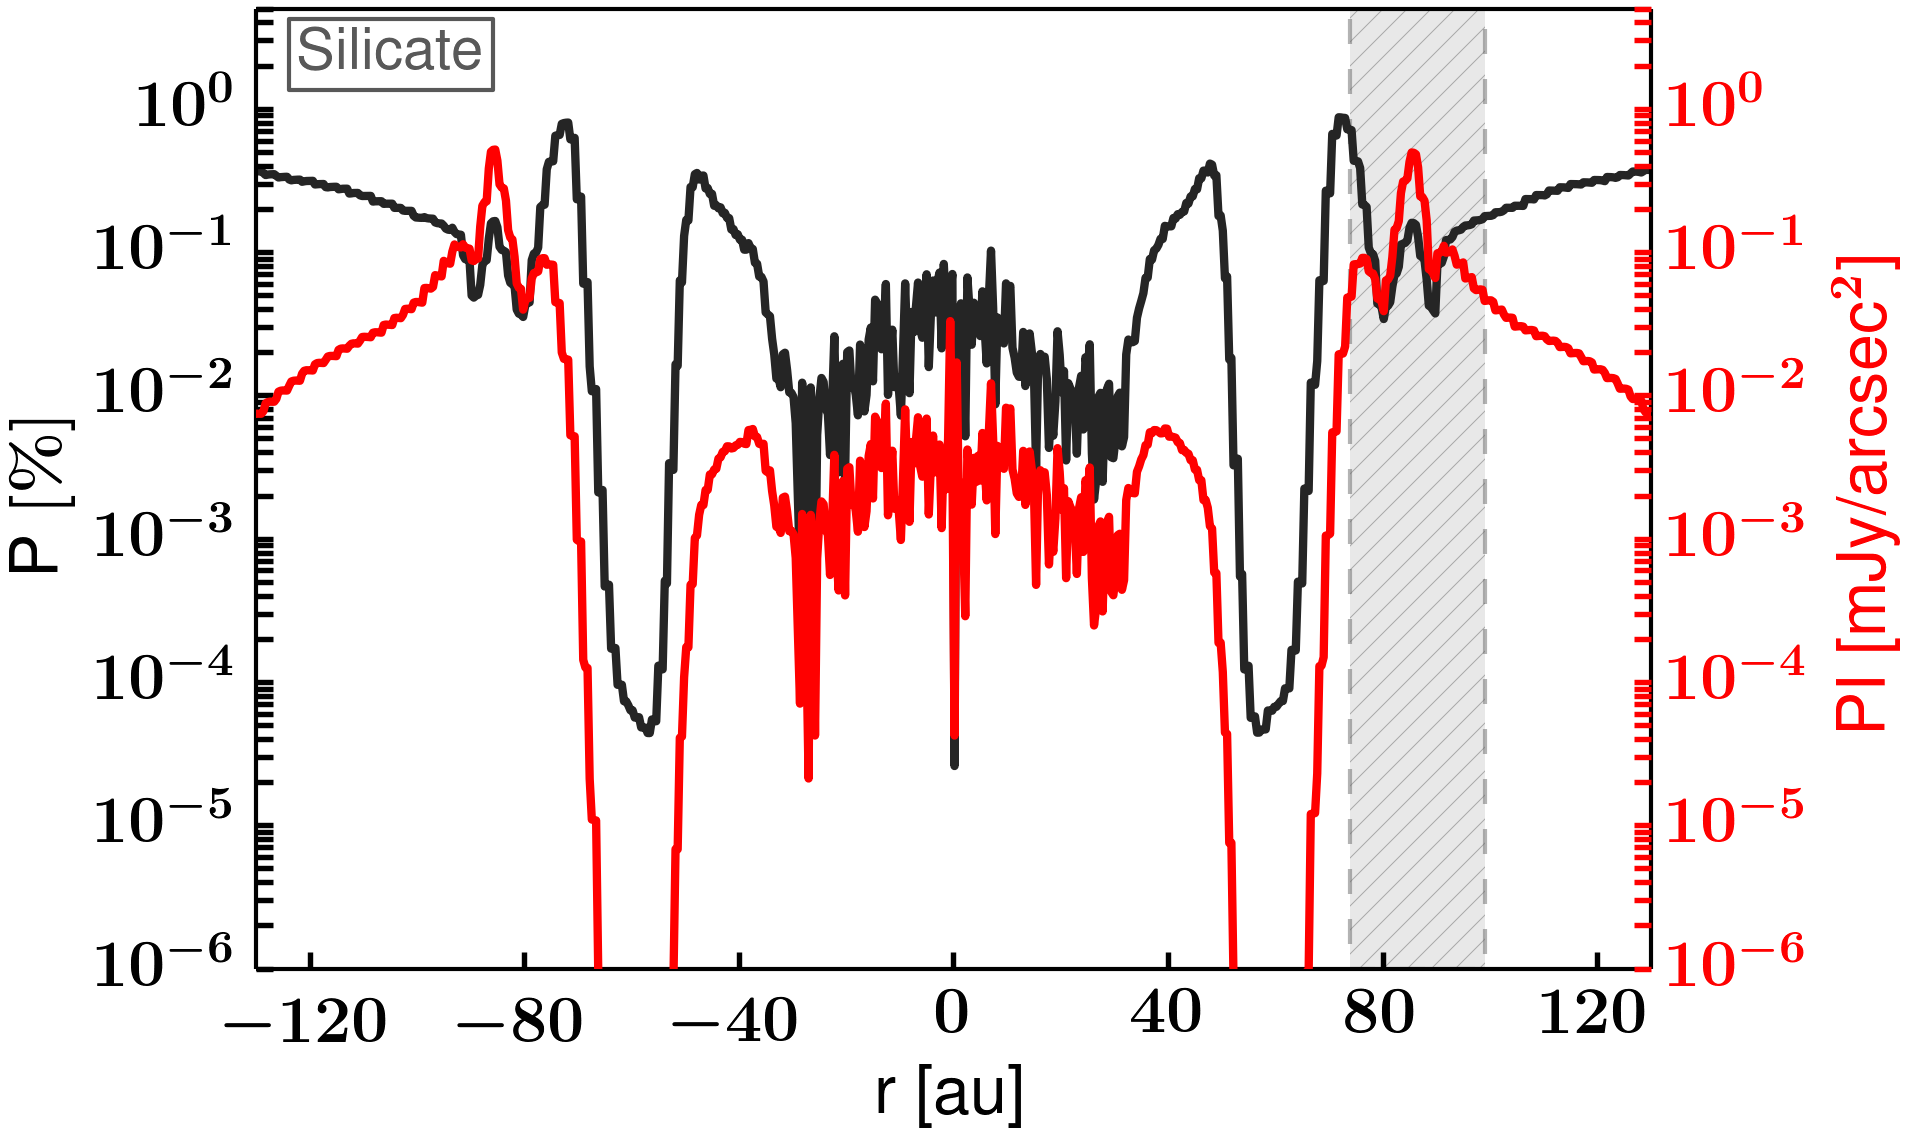
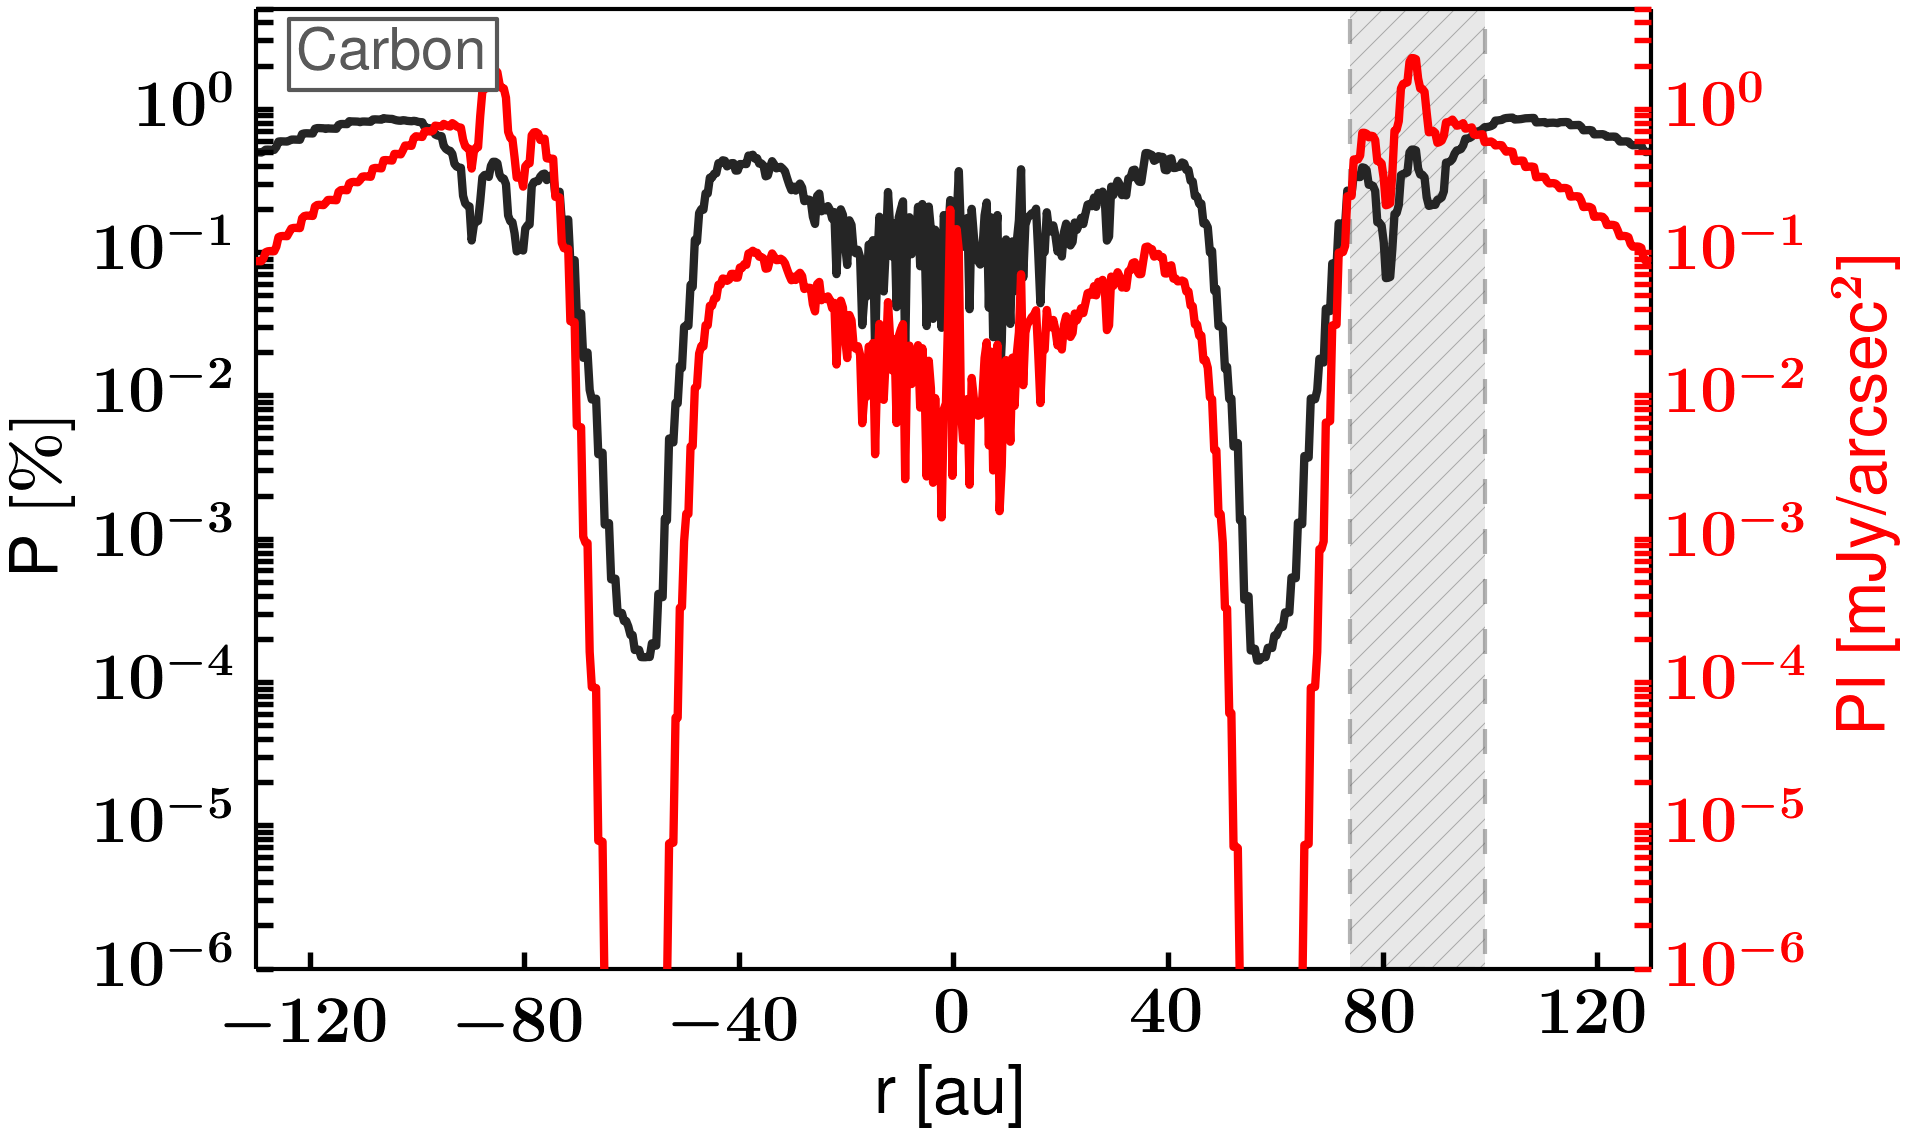
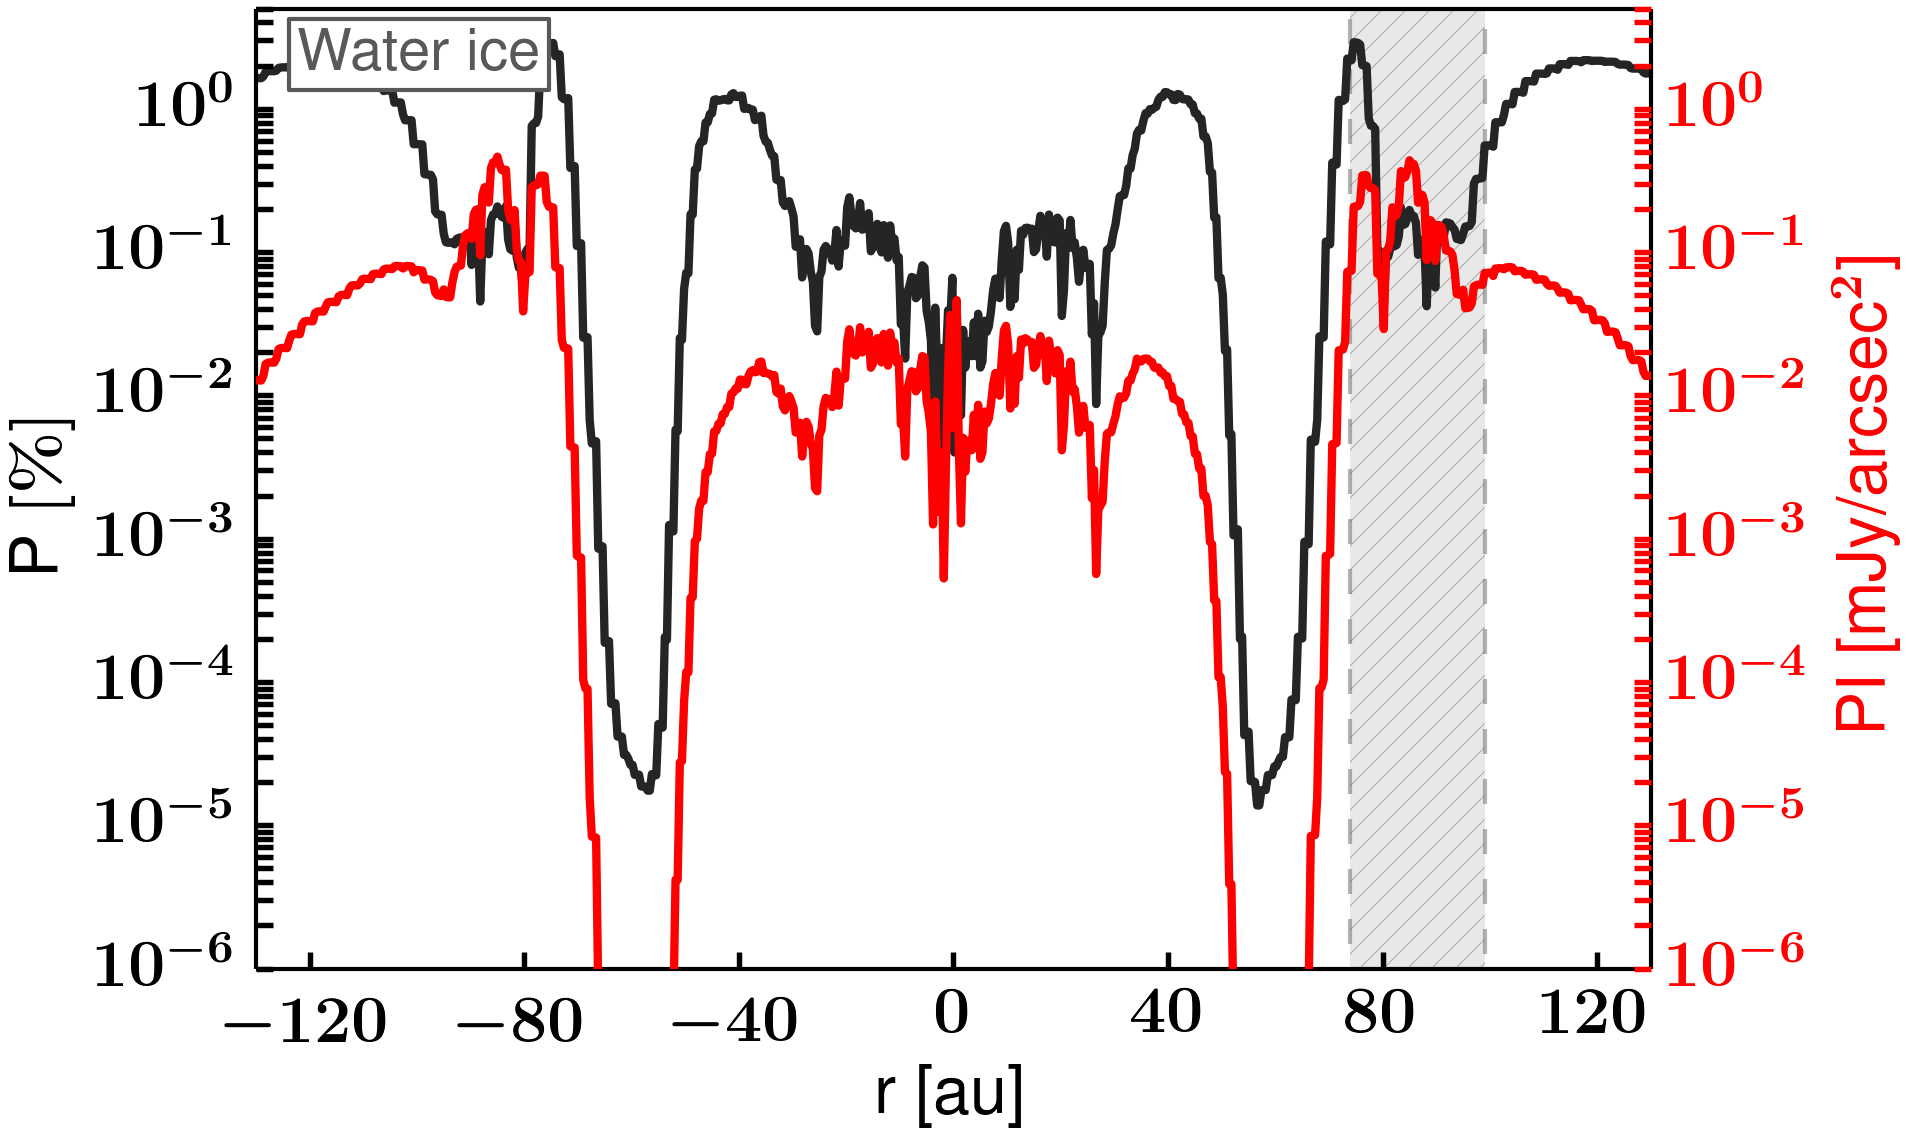
Fig. 13
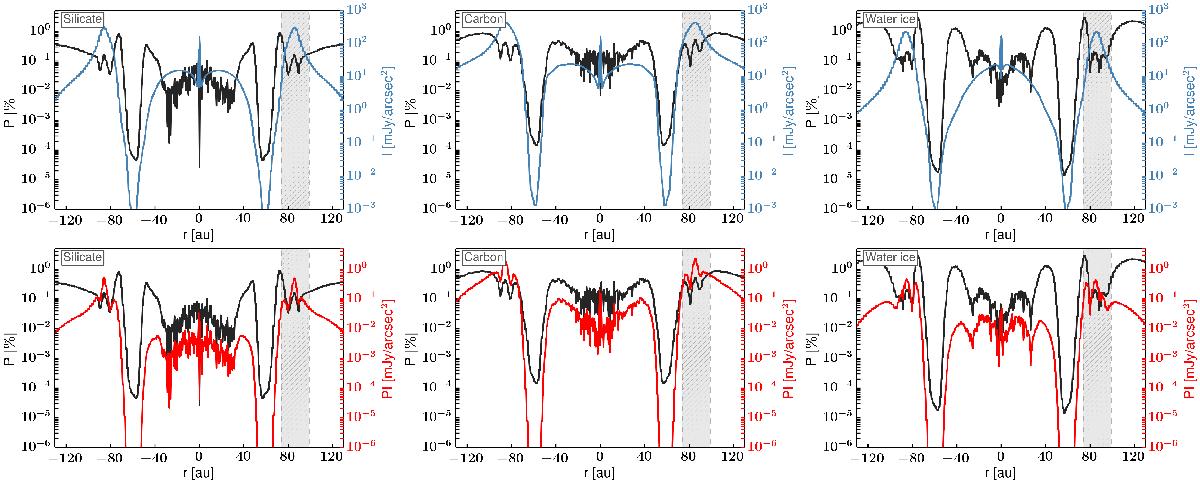
Top row: radial cuts of the intensity (blue) and polarization degree (black) along the major axis. The gray crosshatched area visualizes the location of the highest intensity peak. Bottom row: radial cuts of the polarized intensity (red) and polarization degree (black) along the major axis. The gray shaded area again illustrates the highest polarized intensity peak.

Current usage metrics show cumulative count of Article Views (full-text article views including HTML views, PDF and ePub downloads, according to the available data) and Abstracts Views on Vision4Press platform.
Data correspond to usage on the plateform after 2015. The current usage metrics is available 48-96 hours after online publication and is updated daily on week days.
Initial download of the metrics may take a while.