Fig. 5
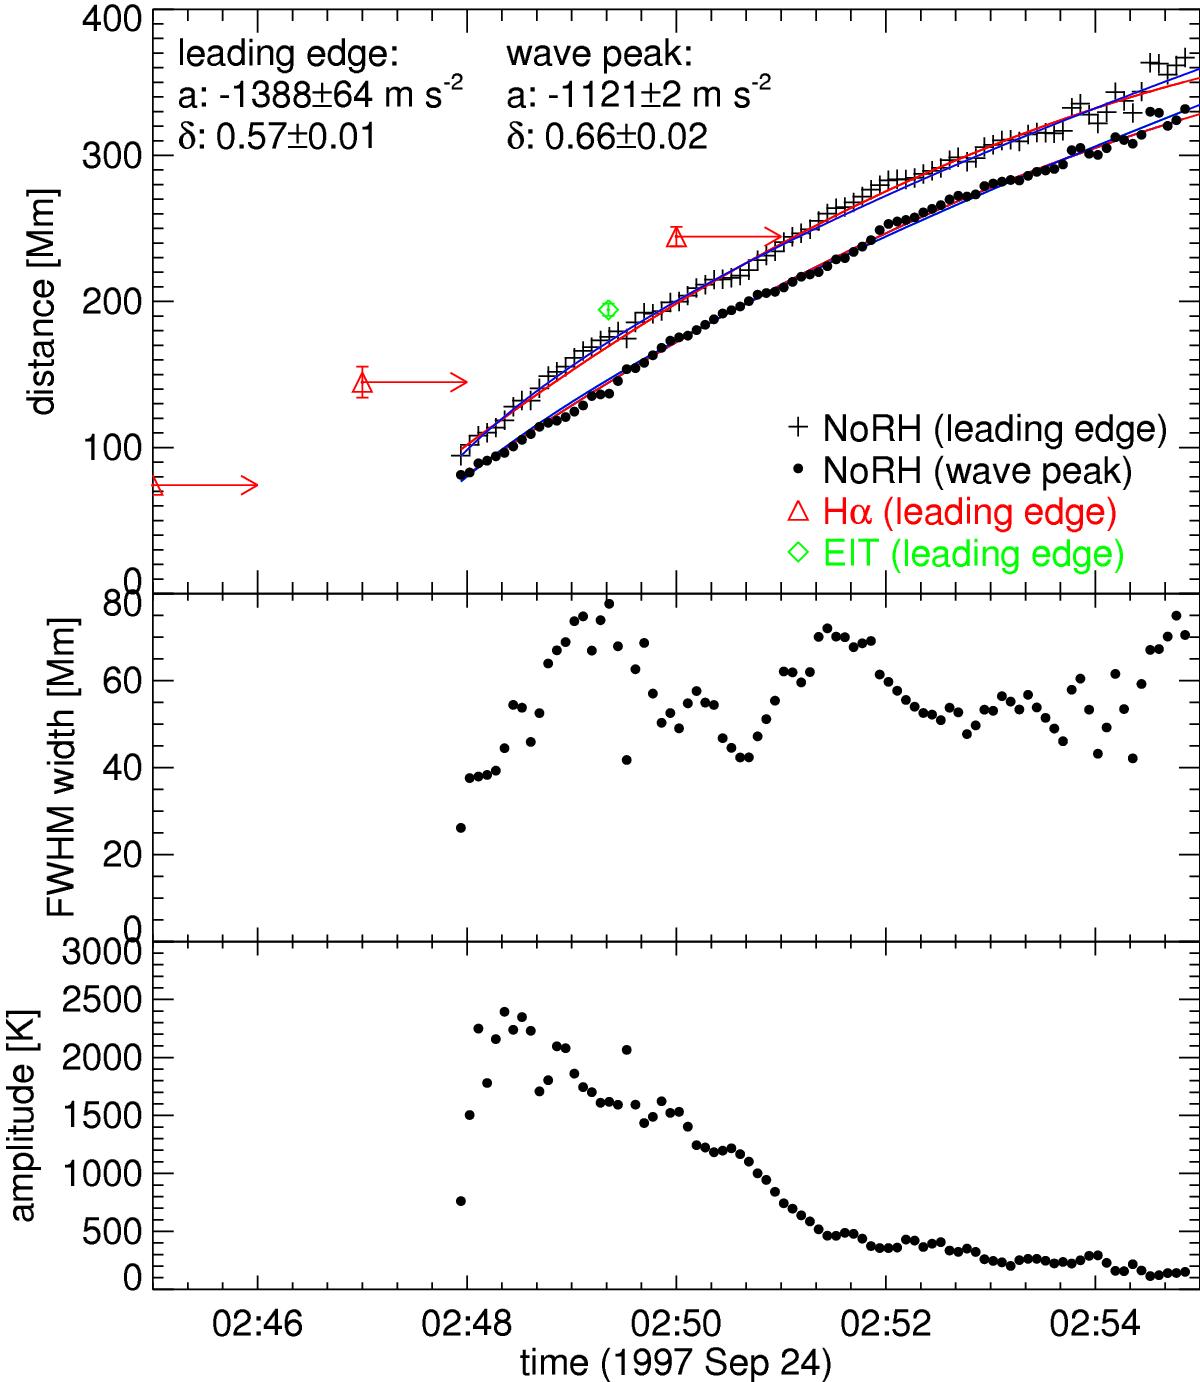
Evolution of the NoRH wave derived from the 17 GHz stack plots shown in Fig. 4 (Koshix algorithm). Top: kinematics of the leading edge and the wave peak. Also shown are second-degree polynomial (red lines) and power-law fits (blue lines), and the corresponding mean acceleration a and the power-law index δ is indicated. For comparison, the leading edges of the Hα (red triangles) and EIT wavefronts (green diamond) are shown as well. Middle: evolution of the wavefront width (FWHM). Bottom: evolution of the perturbation amplitude, ΔTb.
Current usage metrics show cumulative count of Article Views (full-text article views including HTML views, PDF and ePub downloads, according to the available data) and Abstracts Views on Vision4Press platform.
Data correspond to usage on the plateform after 2015. The current usage metrics is available 48-96 hours after online publication and is updated daily on week days.
Initial download of the metrics may take a while.