Free Access
Fig. 4
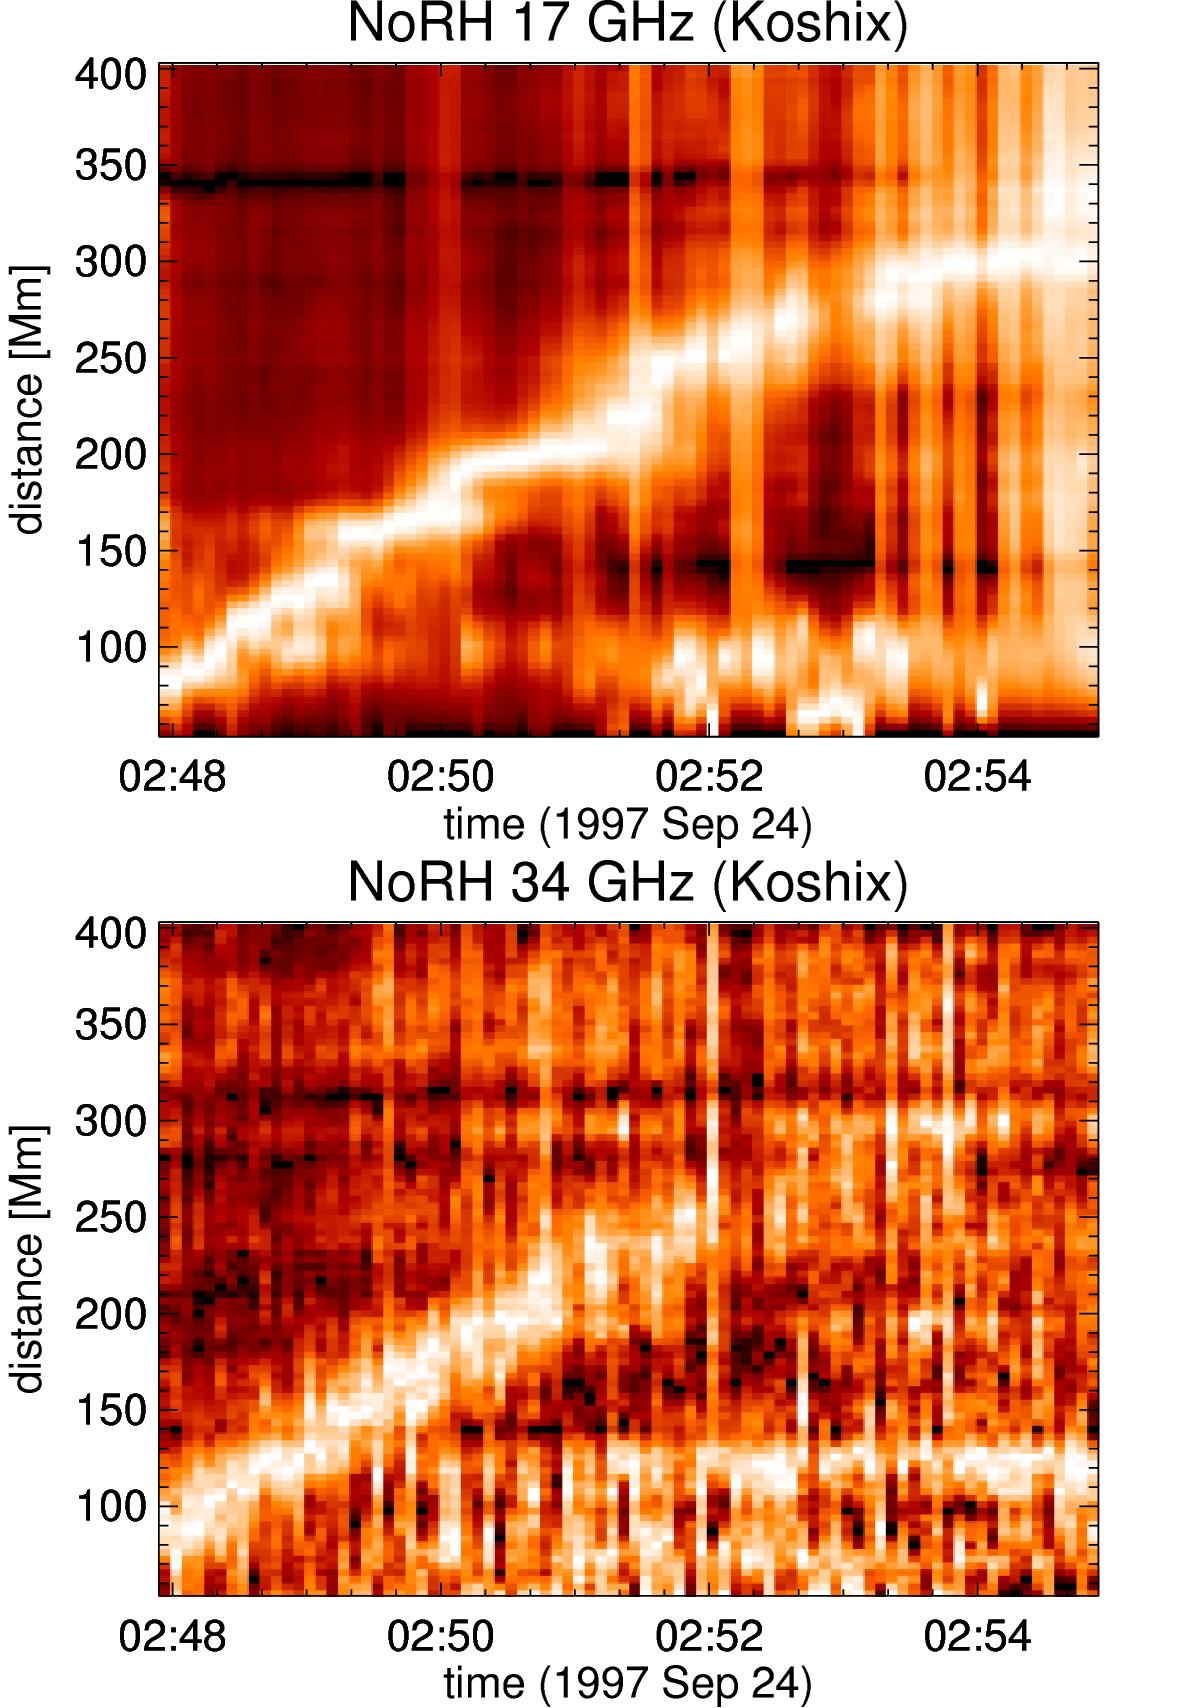
Space-time plots obtained from the sector shown in Fig. 2 using 17 GHz (top) and 34 GHz (bottom) NoRH difference images computed with the Koshix algorithm. The bright feature moving from small to large distances is a clear signature of the wave.
This figure is made of several images, please see below:
Current usage metrics show cumulative count of Article Views (full-text article views including HTML views, PDF and ePub downloads, according to the available data) and Abstracts Views on Vision4Press platform.
Data correspond to usage on the plateform after 2015. The current usage metrics is available 48-96 hours after online publication and is updated daily on week days.
Initial download of the metrics may take a while.