Fig. 3
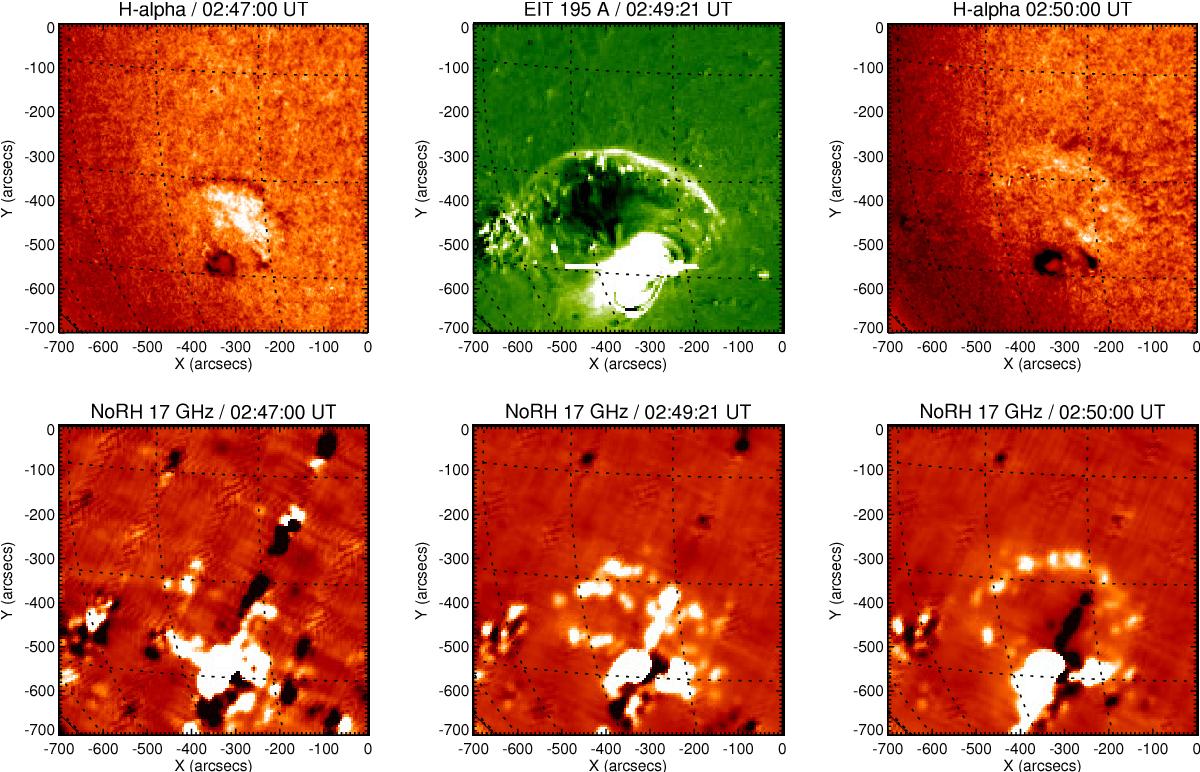
Top row: Hα (left, right) and EIT (middle) images showing the wave event of 1997 Sep. 24. Shown are difference images from which a pre-event frame has been subtracted. The Hα frames were obtained in the red line wing, and the EIT image at 195 Å. The times of the Hα images are only approximate. Bottom row: 17 GHz difference images corresponding in time to the images in the top row.
Current usage metrics show cumulative count of Article Views (full-text article views including HTML views, PDF and ePub downloads, according to the available data) and Abstracts Views on Vision4Press platform.
Data correspond to usage on the plateform after 2015. The current usage metrics is available 48-96 hours after online publication and is updated daily on week days.
Initial download of the metrics may take a while.