Fig. 1
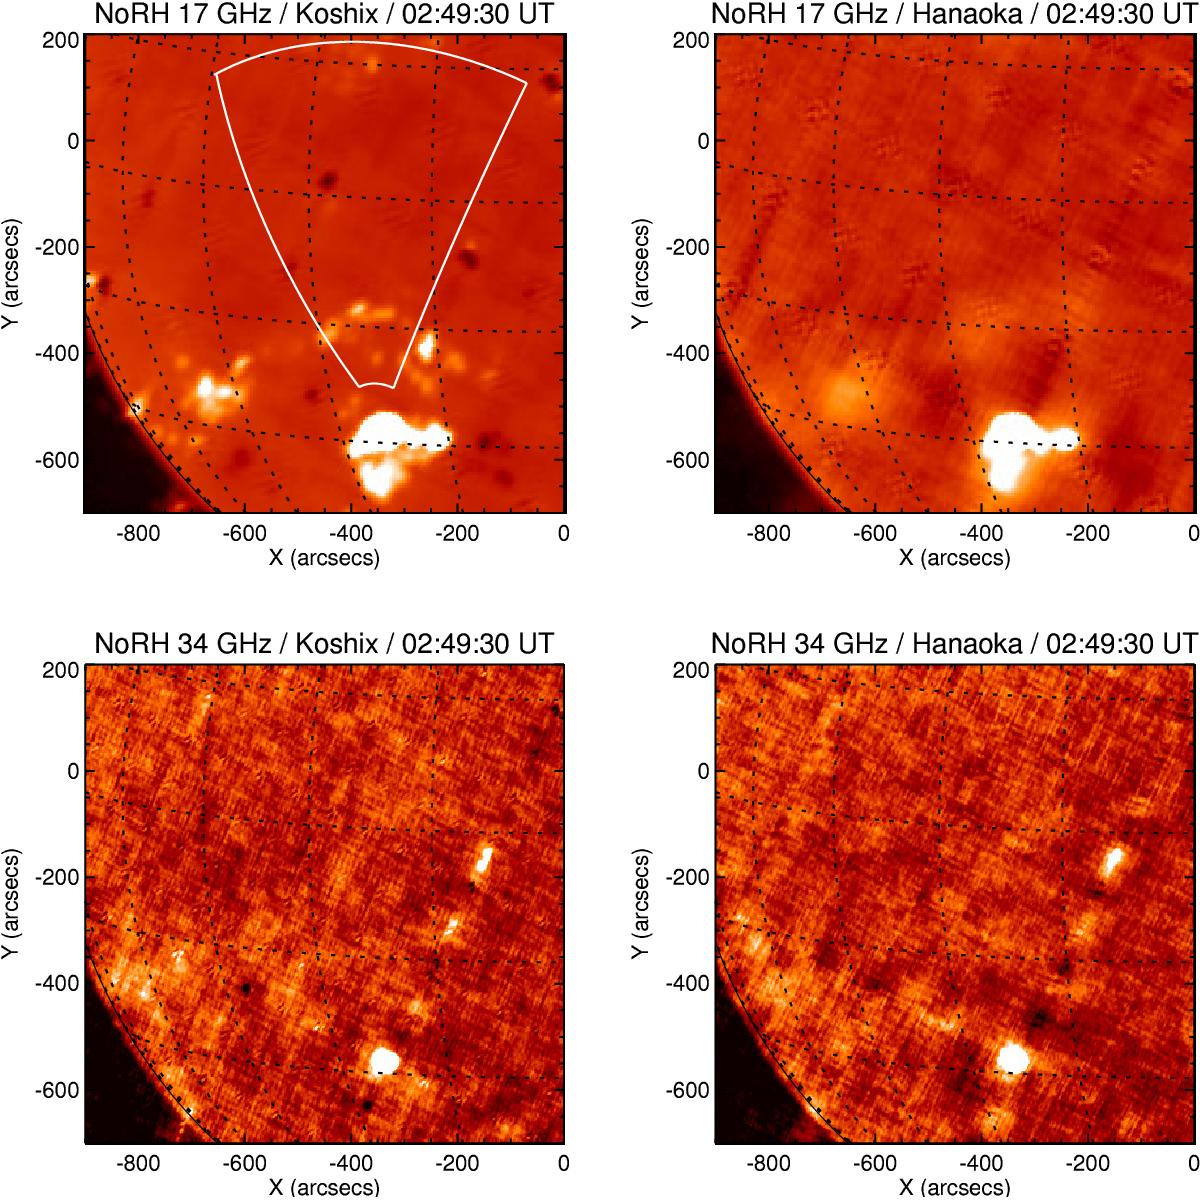
Wave of 1997 Sep. 24 imaged with the Nobeyama radioheliograph at 02:49:30 UT. Shown are brightness temperature maps. The wave is seen as a bright semicircular front north of the flaring AR. Top left: 17 GHz radioheliogram synthesized with the Koshix algorithm. The sector over which the intensity profiles were measured is outlined in white. Top right: 17 GHz radioheliogram synthesized with the Hanaoka algorithm. Bottom left: 34 GHz radioheliogram (Koshix algorithm). Bottom right: 34 GHz radioheliogram (Hanaoka algorithm).
Current usage metrics show cumulative count of Article Views (full-text article views including HTML views, PDF and ePub downloads, according to the available data) and Abstracts Views on Vision4Press platform.
Data correspond to usage on the plateform after 2015. The current usage metrics is available 48-96 hours after online publication and is updated daily on week days.
Initial download of the metrics may take a while.