Fig. 7
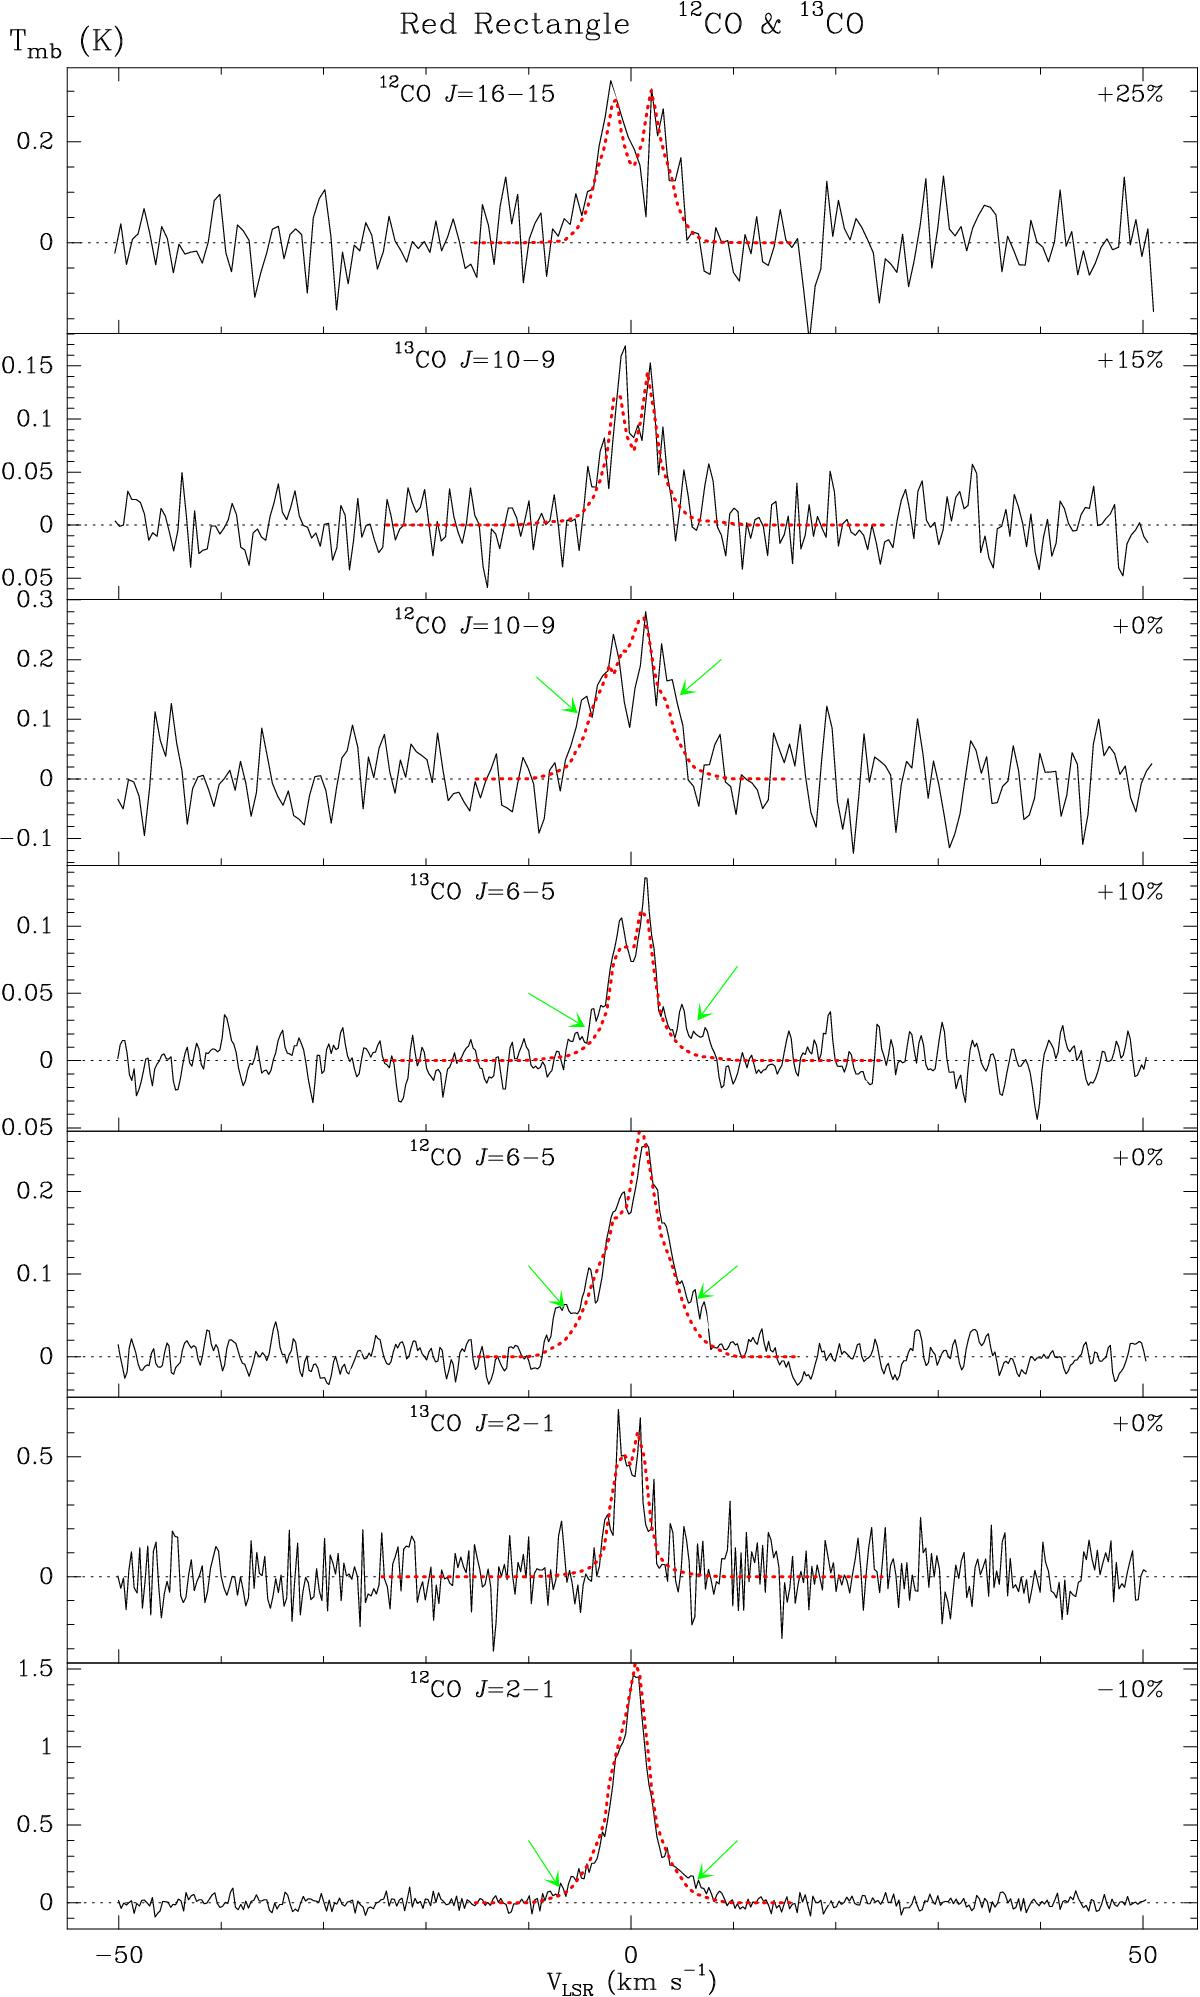
Observed CO line profiles of the mm and FIR transitions (black solid line) and the predictions of our code (red dotted line); see Sect. 5.2. The line-wing emission of some lines is somewhat underestimated (green arrows). The values of the free scale parameter applied to the model predictions that account for uncertainties in the calibration are indicated in the upper right corners.
Current usage metrics show cumulative count of Article Views (full-text article views including HTML views, PDF and ePub downloads, according to the available data) and Abstracts Views on Vision4Press platform.
Data correspond to usage on the plateform after 2015. The current usage metrics is available 48-96 hours after online publication and is updated daily on week days.
Initial download of the metrics may take a while.