Free Access
Fig. B.2
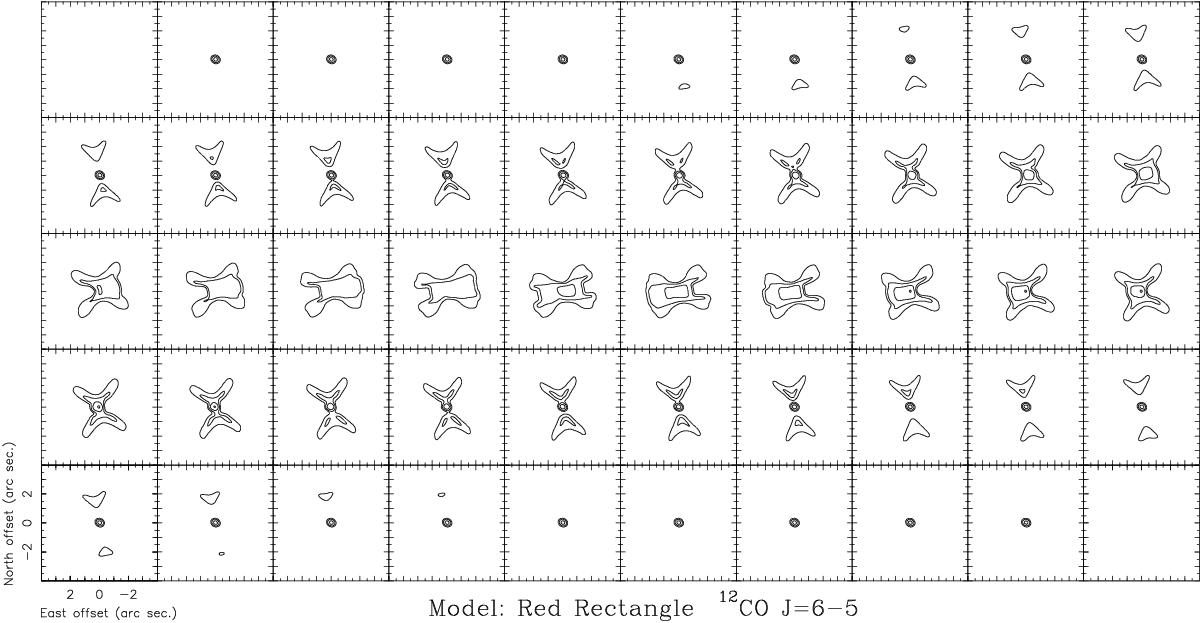
Theoretical maps of 12CO J = 6−5 obtained for our best-fit model, to be compared with ALMA maps published by Bujarrabal et al. (2013b), Fig. 3 in that paper and Fig. B.1 above, in which continuum was not subtracted. The contours and angular and velocity units are the same as in the figure that shows the observational data.
Current usage metrics show cumulative count of Article Views (full-text article views including HTML views, PDF and ePub downloads, according to the available data) and Abstracts Views on Vision4Press platform.
Data correspond to usage on the plateform after 2015. The current usage metrics is available 48-96 hours after online publication and is updated daily on week days.
Initial download of the metrics may take a while.