Fig. A.2
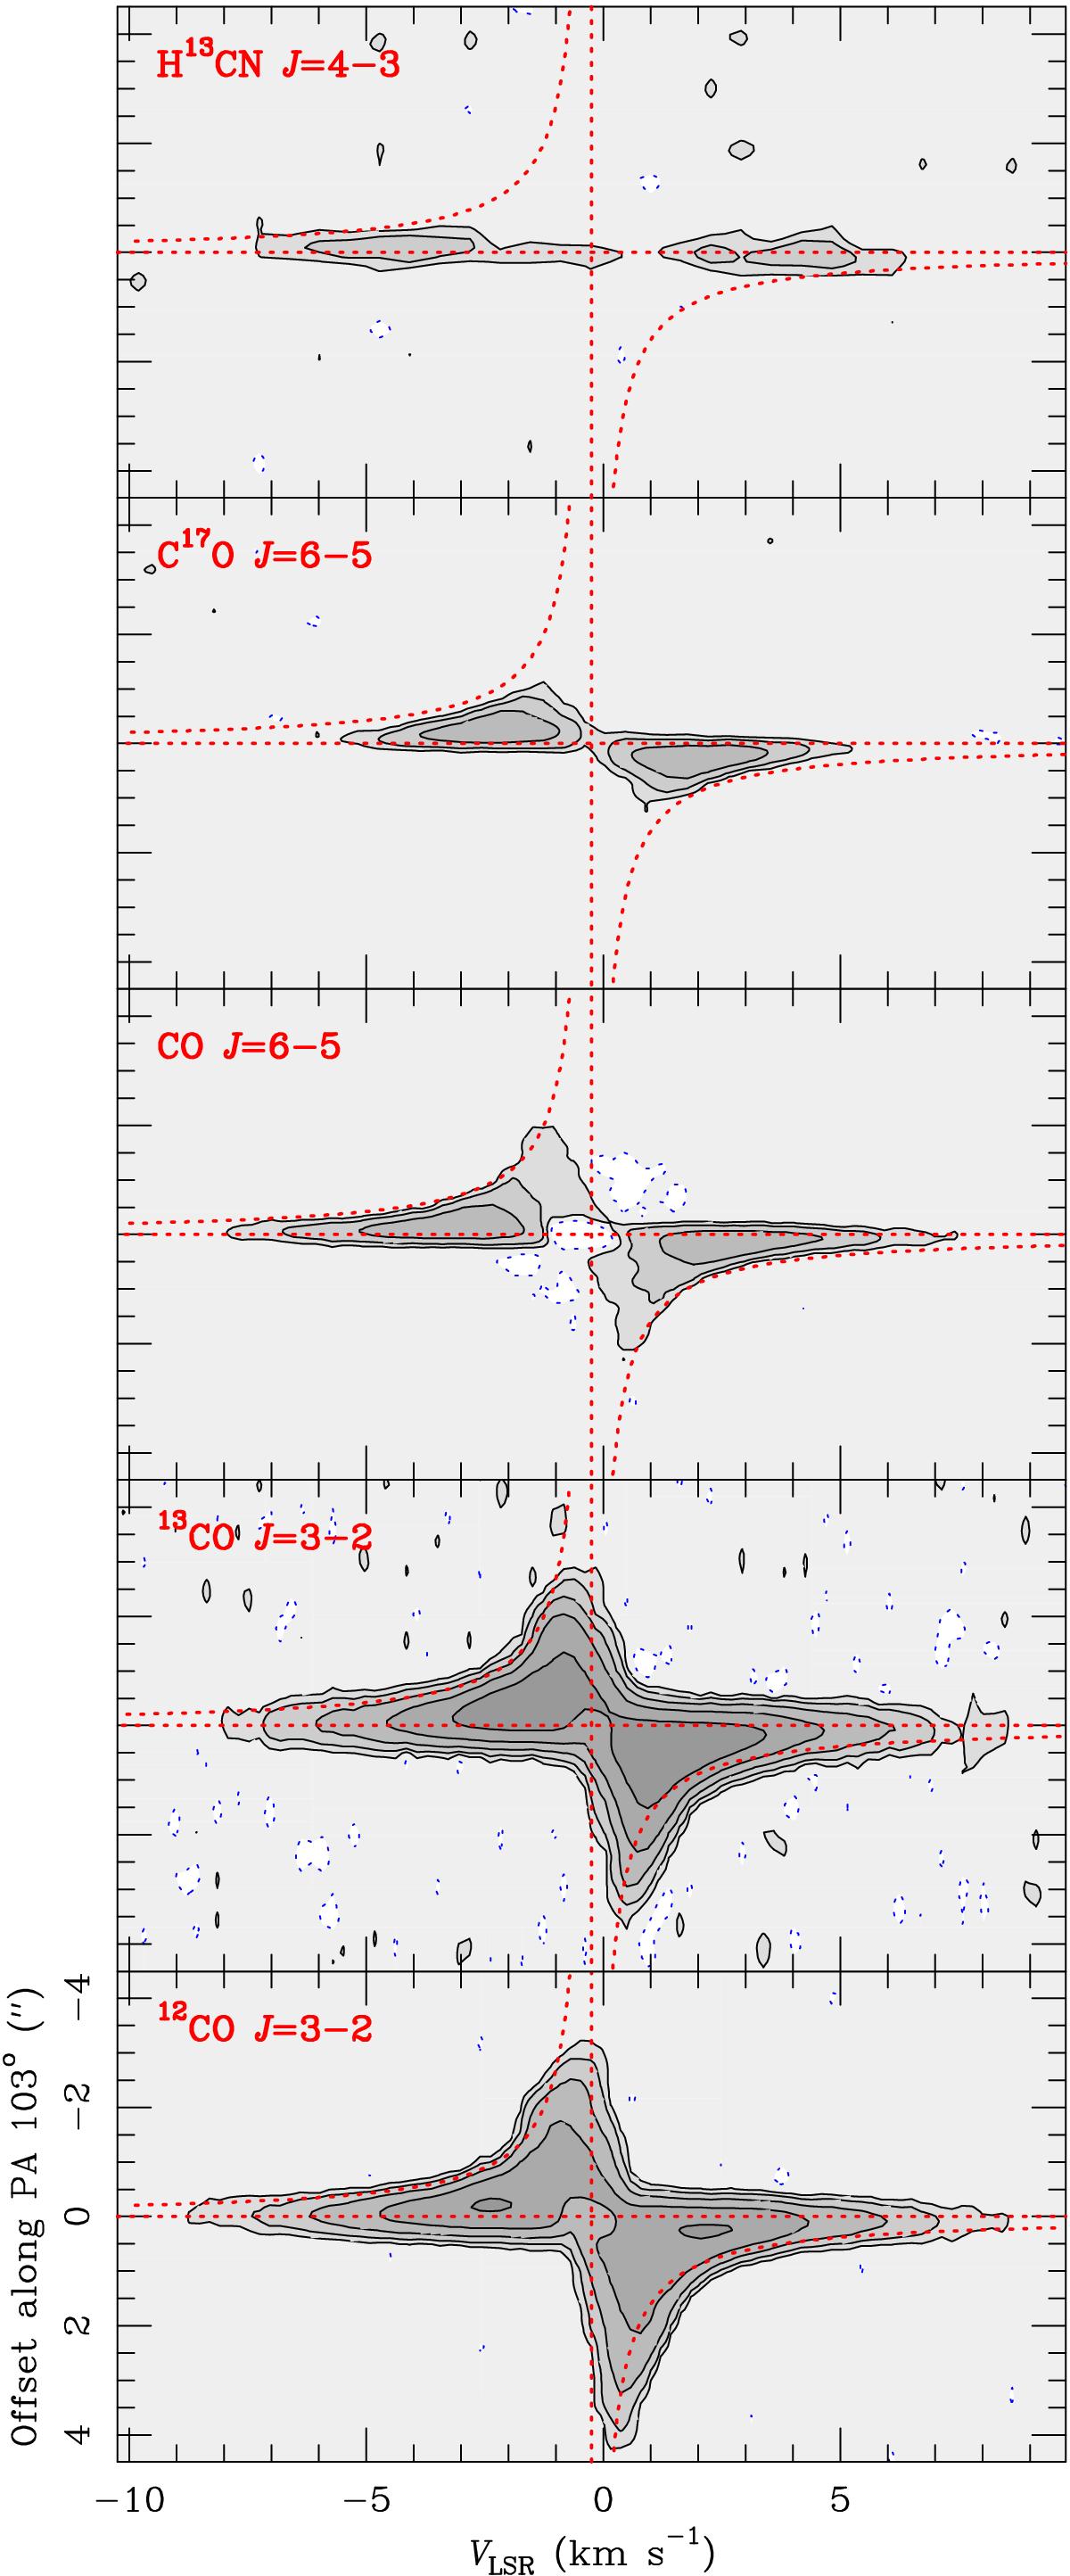
Position-velocity diagrams found along the equatorial direction of the lines observed with ALMA in the Red Rectangle. Contours are, as usual, the same as in the corresponding channel maps. To help in the comparison of the different diagrams, we show (red dotted lines) approximate indications of the central position and systemic velocity of the nebula (horizontal and vertical lines) and of the distributions of the emission of gas in Keplerian rotation (hyperbolas).
Current usage metrics show cumulative count of Article Views (full-text article views including HTML views, PDF and ePub downloads, according to the available data) and Abstracts Views on Vision4Press platform.
Data correspond to usage on the plateform after 2015. The current usage metrics is available 48-96 hours after online publication and is updated daily on week days.
Initial download of the metrics may take a while.