Fig. 1
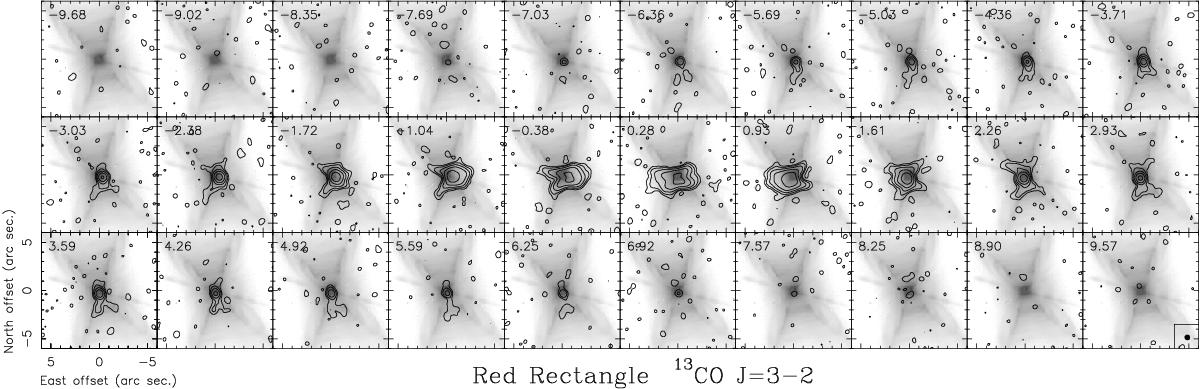
ALMA 13CO J = 3−2 observations of the Red Rectangle. To better show the contribution of the various components, these maps were obtained using natural weighting in the image deconvolution and a velocity resolution of 0.66 km s-1. The resulting beam size (HPBW) is 0.′′59 ×0.′′56 (shown in the insert). The contours are −0.01, 0.01, 0.03, 0.09, 0.27, and 0.81 Jy/beam (logarithmic spacing by a factor 3, equivalent to 0.34, 1.02, 3.06, 9.18, and 27.5 K). We note the large contrast between expanding gas emission and the peak of the equatorial disk brightness, almost by a factor 100. The HST optical image is also shown. As in most maps shown in this paper, we subtracted the continuum.
Current usage metrics show cumulative count of Article Views (full-text article views including HTML views, PDF and ePub downloads, according to the available data) and Abstracts Views on Vision4Press platform.
Data correspond to usage on the plateform after 2015. The current usage metrics is available 48-96 hours after online publication and is updated daily on week days.
Initial download of the metrics may take a while.