Fig. 1
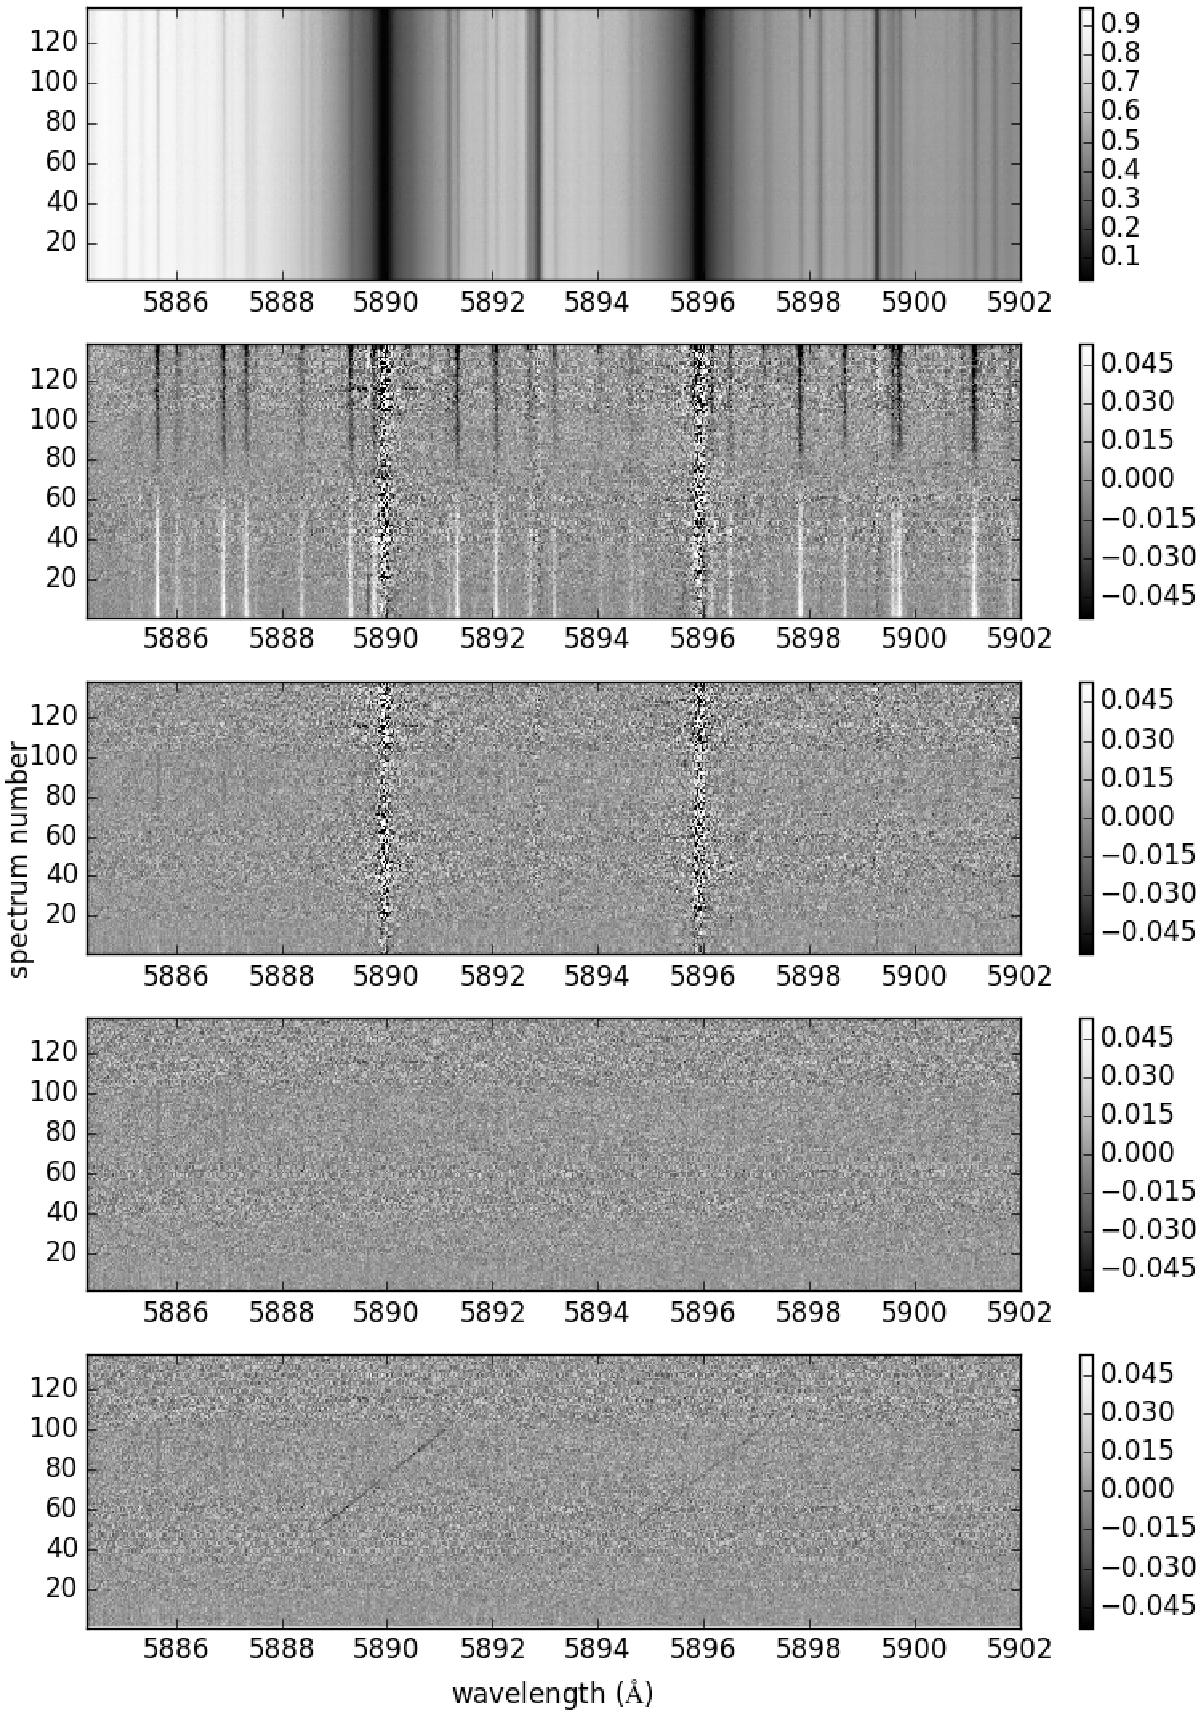
Visual representation of the processing steps as described in Sect. 3. The vertical axis of each matrix represents the sequence number of the observed spectrum. This figure shows the UVES data, but the HARPS and HARPS-N datasets look very similar. The first panel shows the data around the sodium D lines after normalization and alignment in Steps 2 and 3. The second panel shows the residual matrix after dividing through the average star spectrum (Step 5). The third panel shows the residuals after the PCA analysis (Step 7), and the fourth panel shows the same after normalizing each column of the matrix by its standard deviation (Step 8). The bottom panel shows the same data, but after injecting an artificial planet signal before Step 3 − at a level of 3% of the stellar flux. The injected planet signal can be seen as a diagonal trace from spectrum number 53 to 99, resulting from the change in the radial component of the planet orbital velocity during transit.
Current usage metrics show cumulative count of Article Views (full-text article views including HTML views, PDF and ePub downloads, according to the available data) and Abstracts Views on Vision4Press platform.
Data correspond to usage on the plateform after 2015. The current usage metrics is available 48-96 hours after online publication and is updated daily on week days.
Initial download of the metrics may take a while.