Fig. A.1
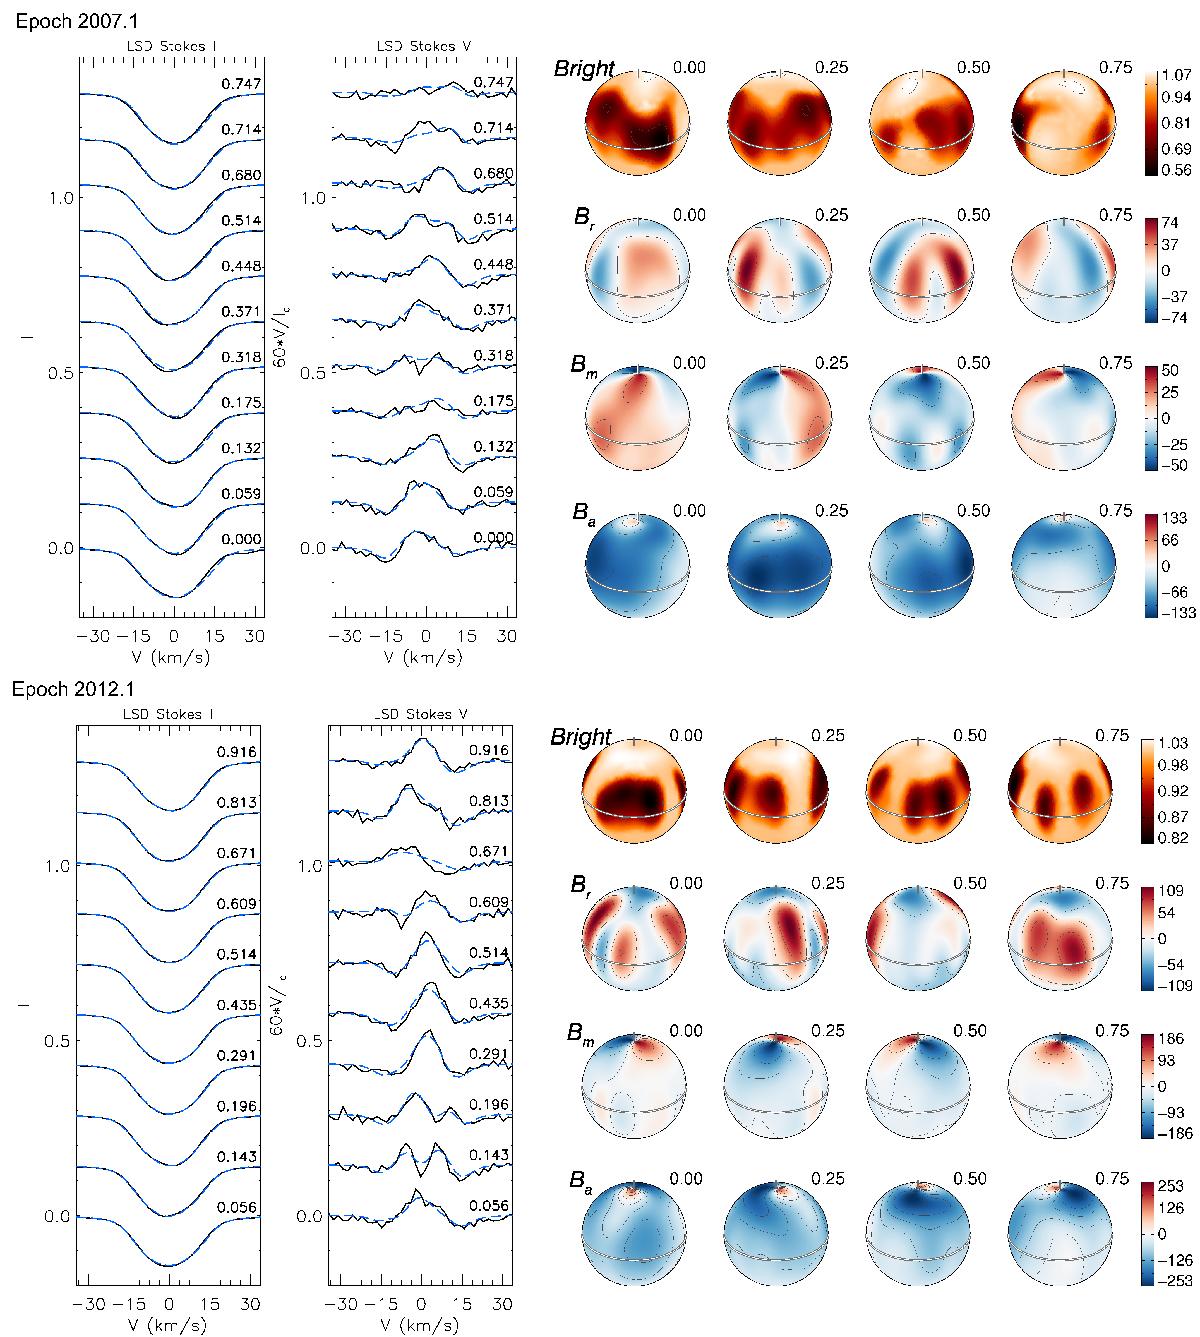
Line profiles and reconstructed brightness and magnetic field distribution of EK Dra. The observed LSD profiles are represented by the black solid lines and the corresponding model profiles are represented by the blue dashed lines. Both the Stokes I and V profiles have been shifted vertically and the Stokes V profiles have been magnified by a factor of 60. Rotational phases are indicated next to each profile. The stellar surface is shown at two different rotational phases. The brightness distribution is shown in the top row of spherical maps; the radial, meridional, and azimuthal field distributions are shown in the following three rows. The magnetic field strength is given in G. The upper set of profiles and maps corresponds to the 2007.1 epoch and the lower to the 2012.1 epoch.
Current usage metrics show cumulative count of Article Views (full-text article views including HTML views, PDF and ePub downloads, according to the available data) and Abstracts Views on Vision4Press platform.
Data correspond to usage on the plateform after 2015. The current usage metrics is available 48-96 hours after online publication and is updated daily on week days.
Initial download of the metrics may take a while.