Fig. 2
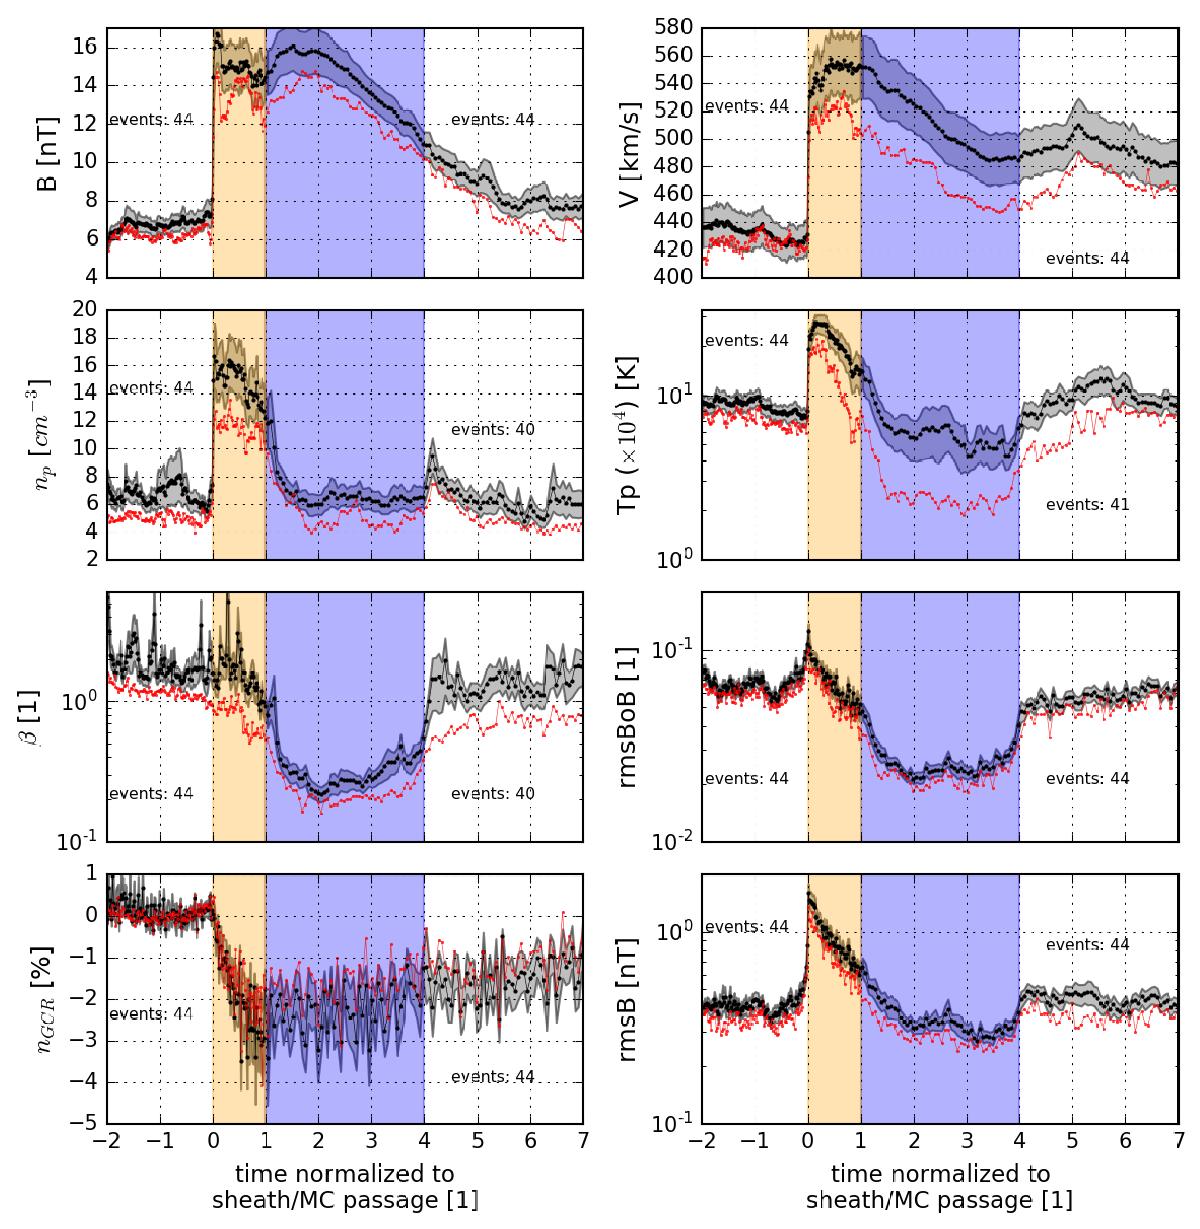
Superposed epoch for different quantities derived with the method described in Sect. 3.1. The sheath is shown with an orange background colour (time range 0 <t< 1) and the MC with a blue background colour (1 <t< 4). The time t is normalised with the sheath duration for t< 1 and with the MC duration for t> 1 (the MC duration is three times longer than the sheath duration as observed in average). The black dots, connected with a line, are averaged values for each bin on the time axis, the grey band represents the error of the mean and the red line represents the median values in each time bin. The average profiles were computed filtering those events that had less than 20% of data gaps in the transient structure (MC or sheath). The number of events after filtering is shown in each panel. The panels represent: magnetic field B, bulk velocity V, proton density np, proton temperature Tp, plasma beta β, normalised magnetic-fluctuation density rmsBoB (Eq. (1)), GCR intensity normalised to the pre-ICME level nGCR and absolute magnetic fluctuation rmsB, Eq. (2). A clear discontinuity of the magnetic fluctuation intensity, rmsB, is present at the shock position (front of the sheath). The normalised magnetic fluctuations, rmsBoB, inside the MC are significantly lower than in the ambient solar wind (by a factor of ≃3).
Current usage metrics show cumulative count of Article Views (full-text article views including HTML views, PDF and ePub downloads, according to the available data) and Abstracts Views on Vision4Press platform.
Data correspond to usage on the plateform after 2015. The current usage metrics is available 48-96 hours after online publication and is updated daily on week days.
Initial download of the metrics may take a while.