Free Access
Fig. 21
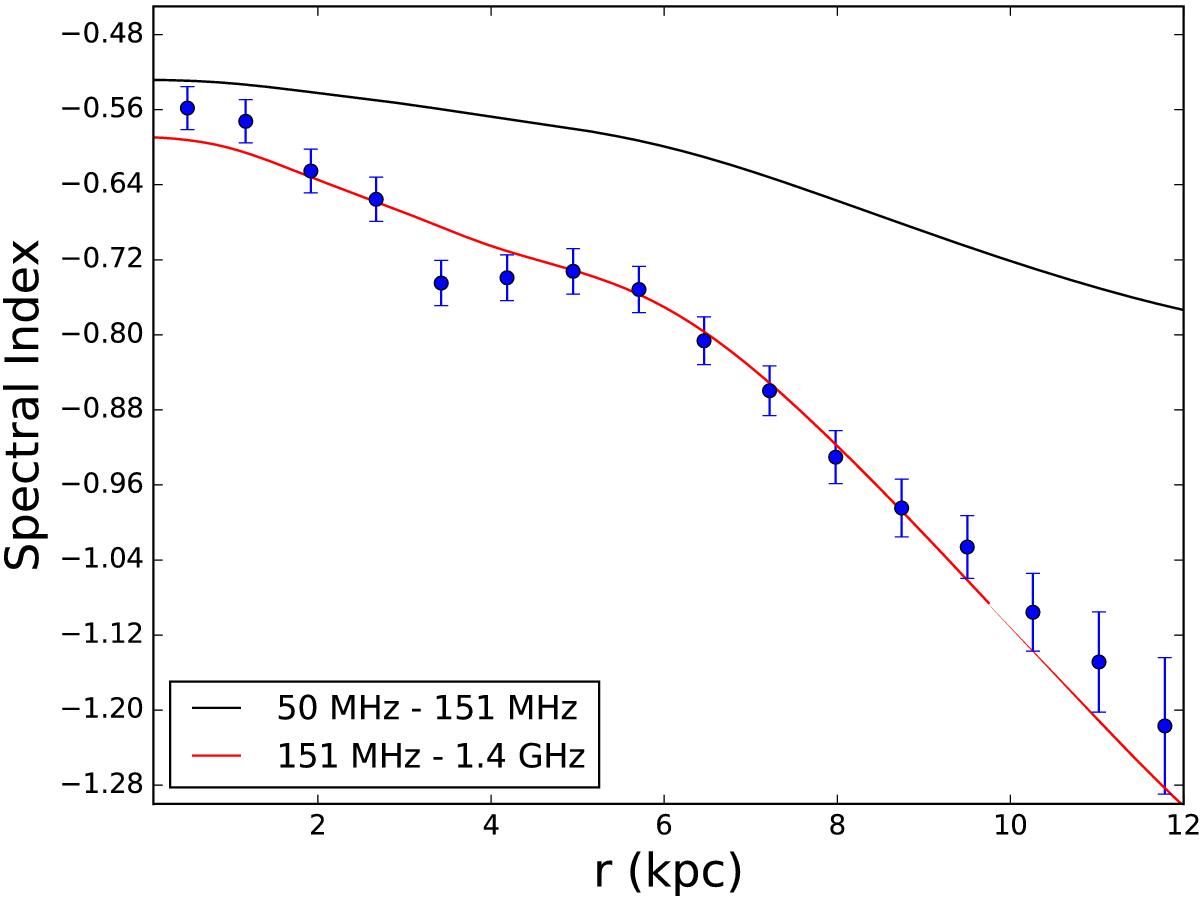
Prediction of the radial variation of the spectral index between 50 MHz–151 MHz (black line), plotted with the observed points with error bars and modelled spectra between 151 MHz–1.4 GHz.
Current usage metrics show cumulative count of Article Views (full-text article views including HTML views, PDF and ePub downloads, according to the available data) and Abstracts Views on Vision4Press platform.
Data correspond to usage on the plateform after 2015. The current usage metrics is available 48-96 hours after online publication and is updated daily on week days.
Initial download of the metrics may take a while.