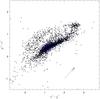
Fig. 1
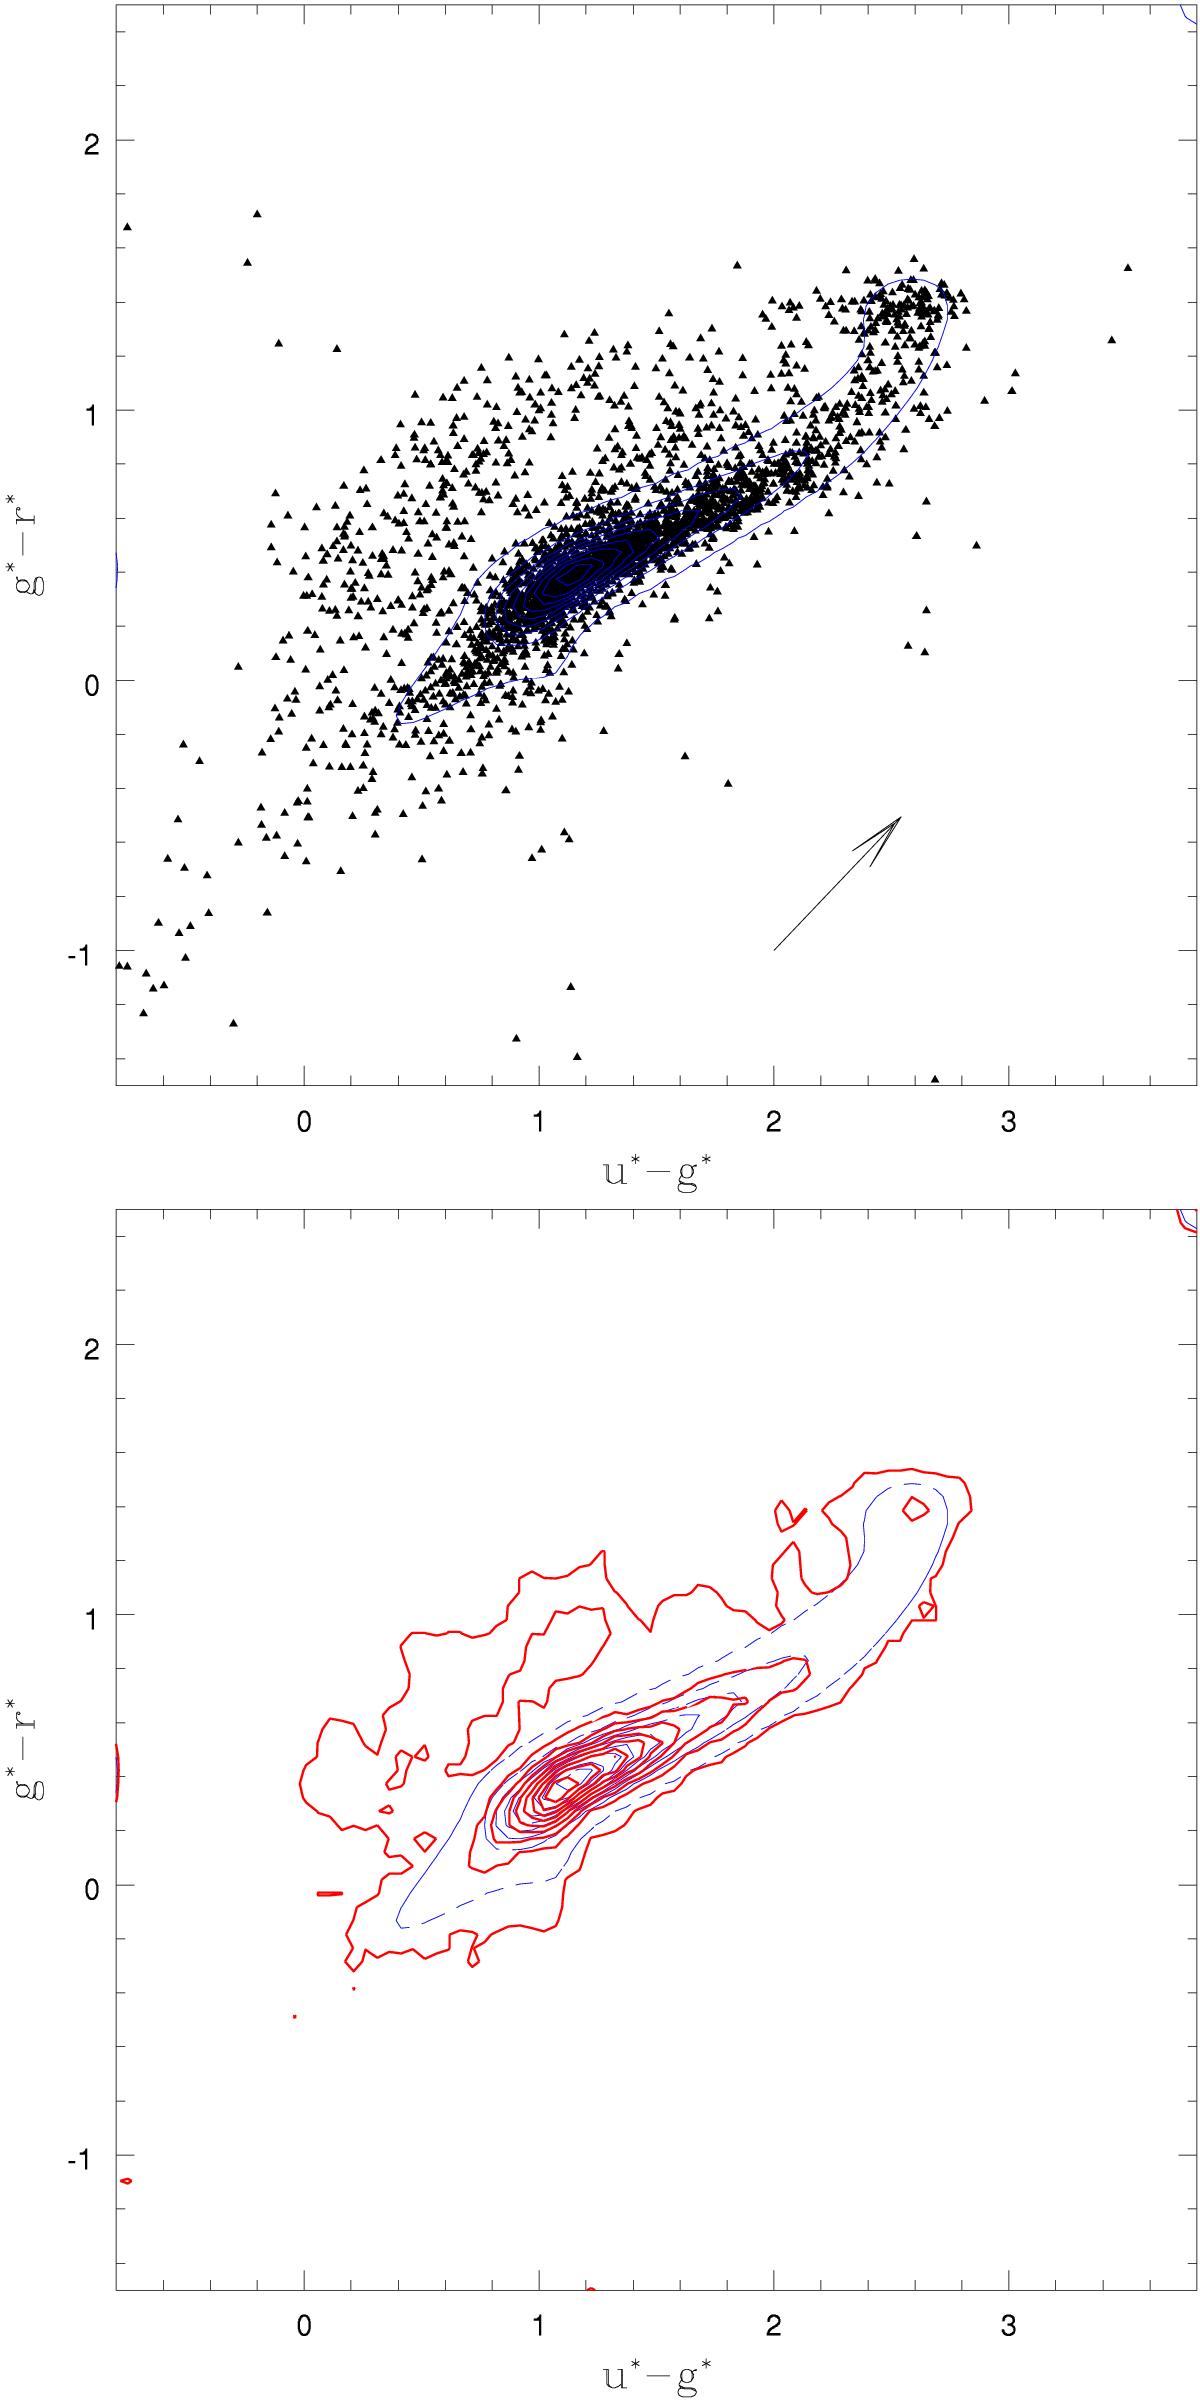
Top panel: position of the CID candidates in the dereddened colour–colour diagram together with the stellar locus based on 26 million Star colours (i.e. 10% of the stellar content of SDSS). The arrow denotes the extinction (Schlafly & Finkbeiner 2011). Bottom panel: contour lines for the CID candidates (thick) and 10% of the stellar content of SDSS (thin dashed).
Current usage metrics show cumulative count of Article Views (full-text article views including HTML views, PDF and ePub downloads, according to the available data) and Abstracts Views on Vision4Press platform.
Data correspond to usage on the plateform after 2015. The current usage metrics is available 48-96 hours after online publication and is updated daily on week days.
Initial download of the metrics may take a while.