Fig. 3
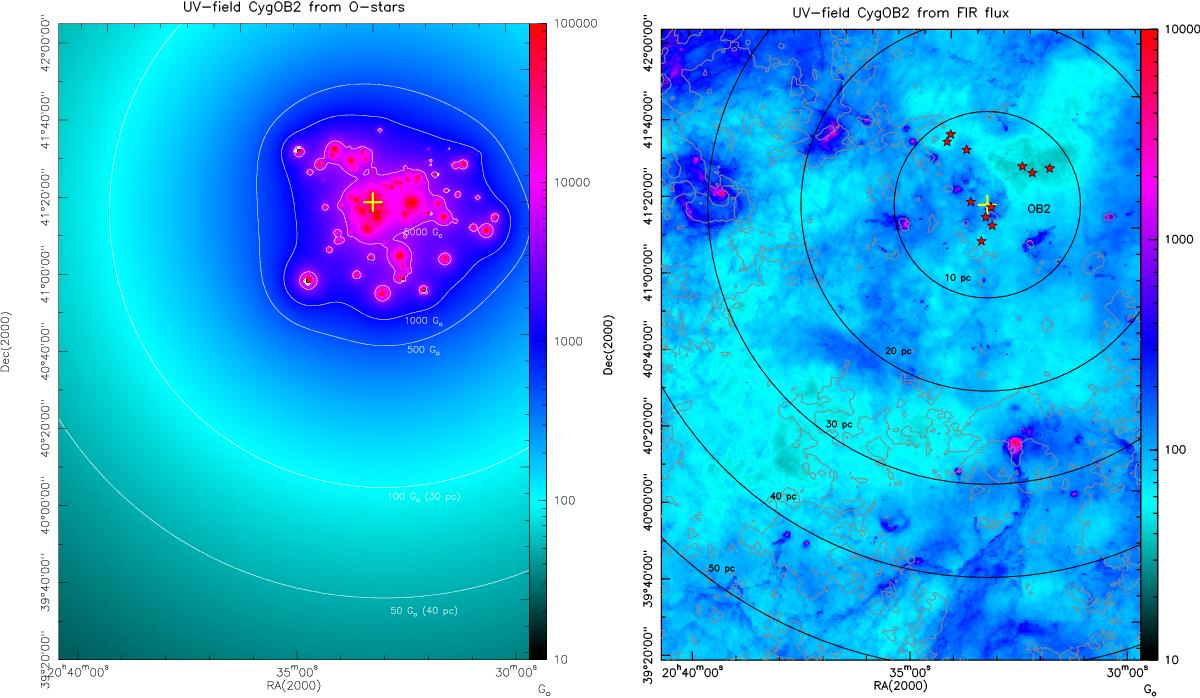
Left: UV-field in units of Habing (G0) determined from a census of all O-stars given in Wright et al. (2015). Right: UV-field in units of Habing (G0) for the central region around Cyg OB2 (limits as in Fig. 2) determined from the Herschel 70 μm and 160 μm fluxes. This image shows the impinging radiation. The most luminous O-stars of Cyg OB2 (Wright et al. 2015) are indicated as red stars and the yellow cross indicates the approximate center of the association. Concentric circles indicate the projected distance to this center in the plane of the sky, assuming a distance of 1.4 kpc to Cyg OB2. Gray contours (2 K kms-1 to 22 K kms-1 in steps of 2 K kms-1) display line integrated (−10 to 20 km s-1) 13CO 1 → 0 emission at a resolution of 45′′ (Schneider et al. 2011).
Current usage metrics show cumulative count of Article Views (full-text article views including HTML views, PDF and ePub downloads, according to the available data) and Abstracts Views on Vision4Press platform.
Data correspond to usage on the plateform after 2015. The current usage metrics is available 48-96 hours after online publication and is updated daily on week days.
Initial download of the metrics may take a while.