Fig. 5
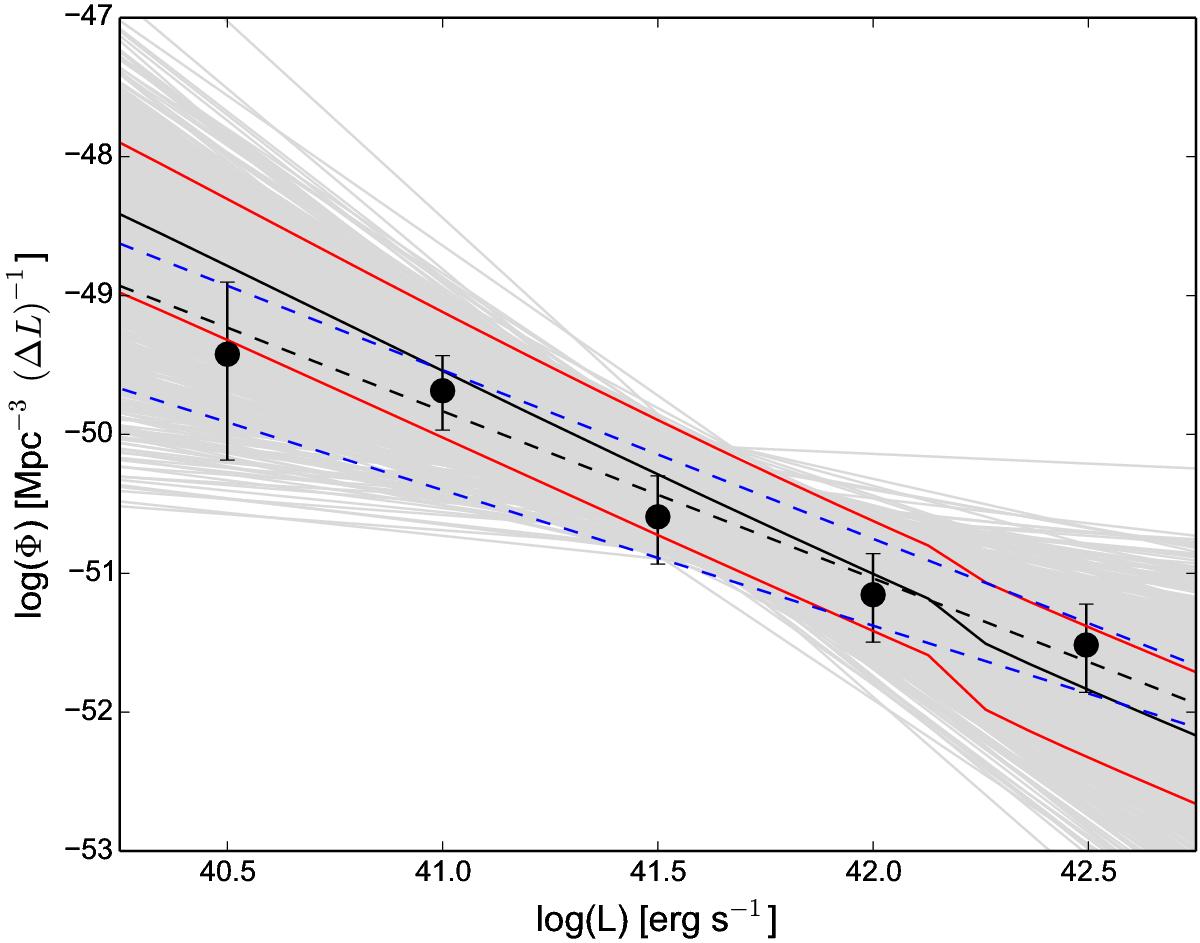
HERGs LF with relativistic beaming added for bulk Lorentz factor Γ = 10 and ratio f = 1. Black solid line indicates the model; red solid lines indicate the maximum and minimum values for the model. Black circles show F-NLS1s data, black dashed line shows the F-NLS1s LF best-fit, and blue dashed lines indicate the maximum and minimum values for F-NLS1s LF. The light gray lines denote the simulated LFs for F-NLS1s.
Current usage metrics show cumulative count of Article Views (full-text article views including HTML views, PDF and ePub downloads, according to the available data) and Abstracts Views on Vision4Press platform.
Data correspond to usage on the plateform after 2015. The current usage metrics is available 48-96 hours after online publication and is updated daily on week days.
Initial download of the metrics may take a while.