Free Access
Fig. 3
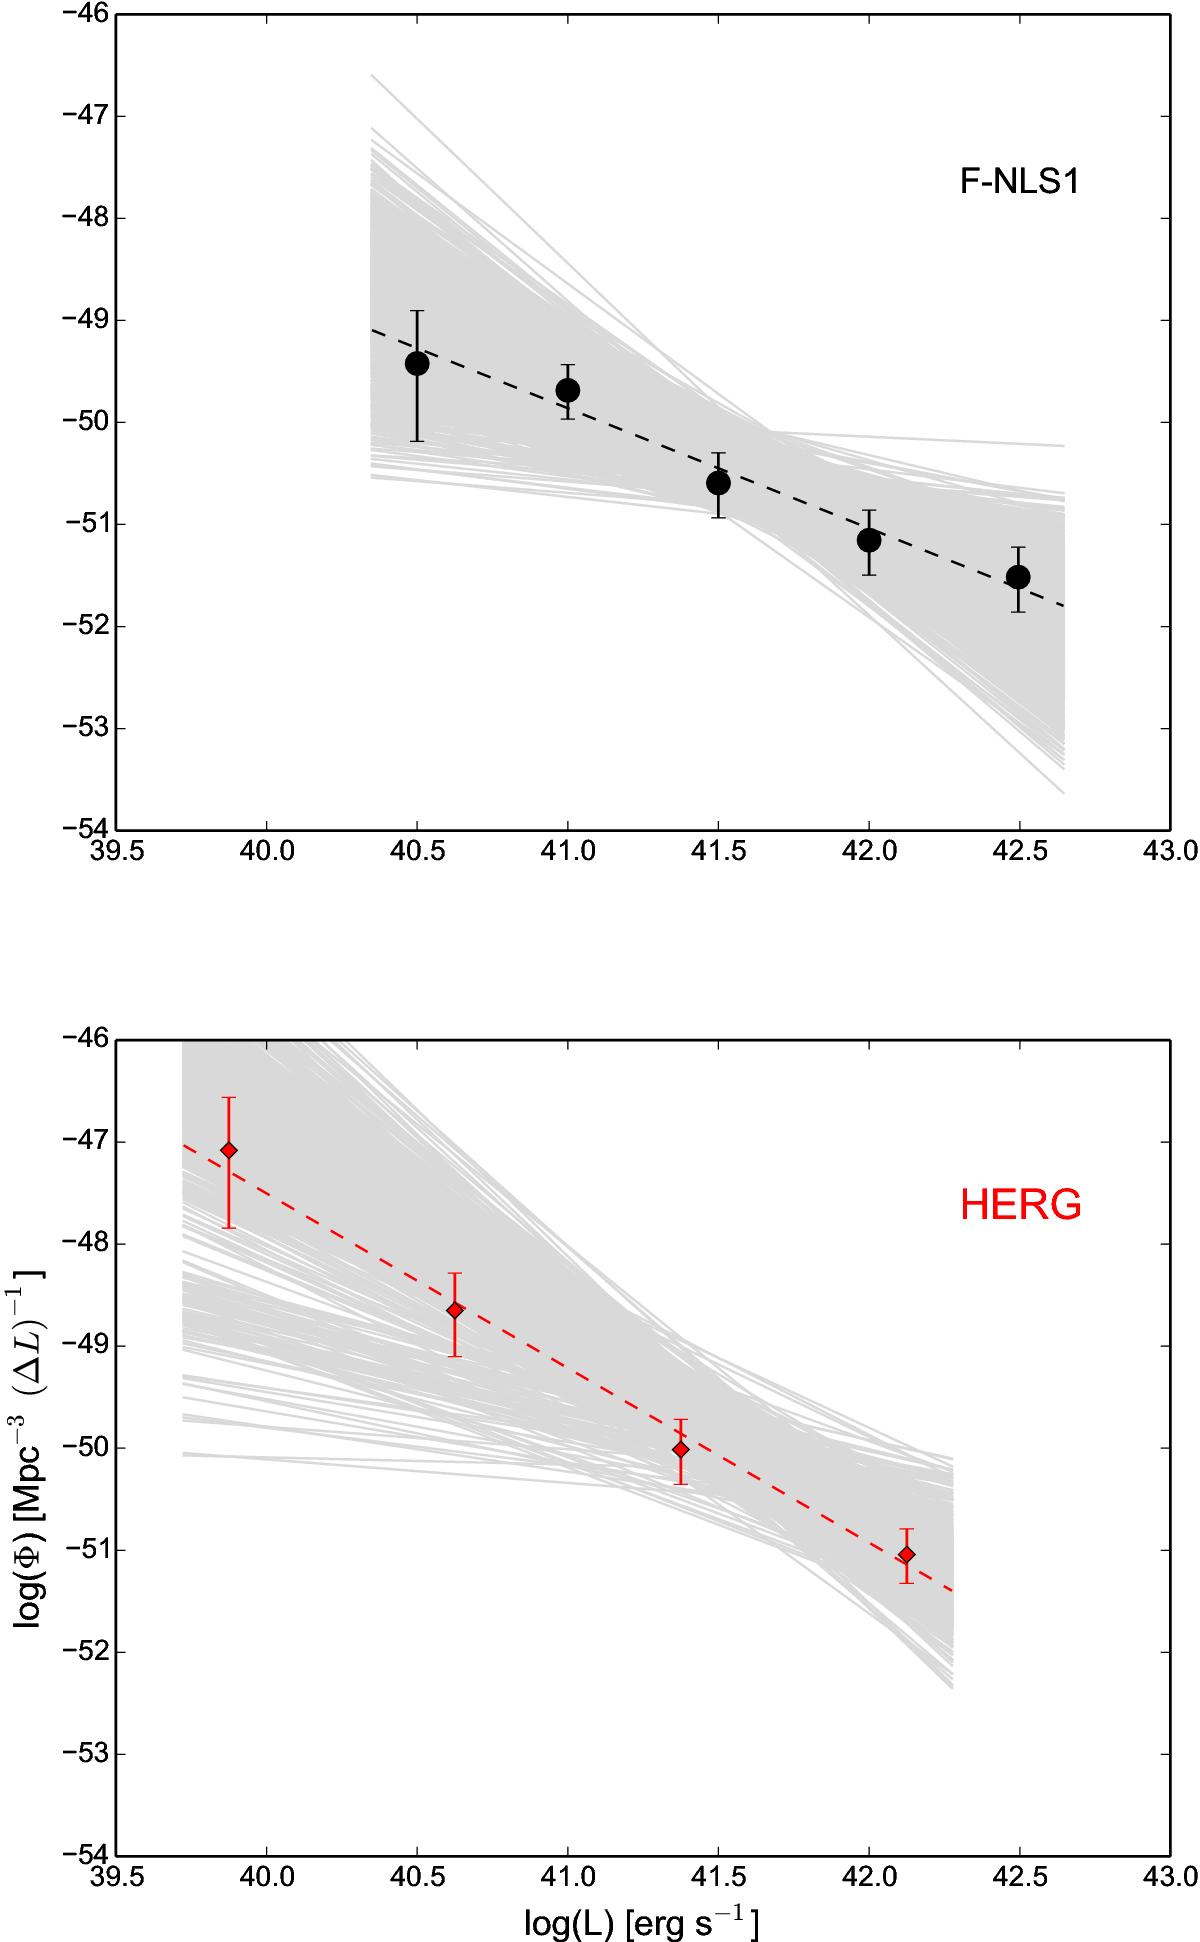
Monochromatic radio luminosity functions at 1.4 GHz. Top panel: F-NLS1s; bottom panel: HERGs. Dashed lines indicate the single power law that is best fit. The light gray lines indicate the simulated luminosity functions obtained via Monte Carlo method, as described in the text.
This figure is made of several images, please see below:
Current usage metrics show cumulative count of Article Views (full-text article views including HTML views, PDF and ePub downloads, according to the available data) and Abstracts Views on Vision4Press platform.
Data correspond to usage on the plateform after 2015. The current usage metrics is available 48-96 hours after online publication and is updated daily on week days.
Initial download of the metrics may take a while.