Fig. 2
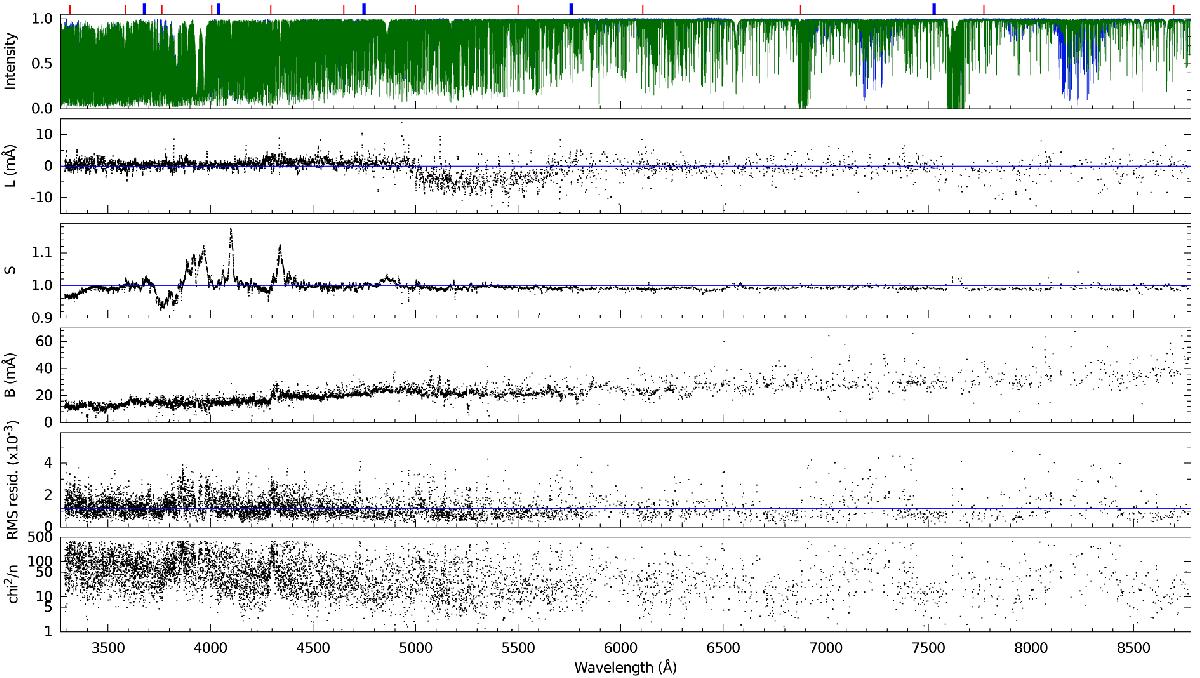
Investigated spectral region (topmost panel; blue trace: Hamburg, green trace: Liège) and the results from the fitting procedure (parameters L, S, B of Eq. (1), the rms of the residuals of the fit, and the reduced χ2) versus wavelength. The thin red tick marks and the bold blue tick marks above the topmost panel indicate grating order intersections and FTS scan intersections, respectively. Zero wavelength shift and unity scaling factors are indicated by the horizontal blue lines in the L and S panels. The blue line in the trace of the rms residuals indicates the median value.
Current usage metrics show cumulative count of Article Views (full-text article views including HTML views, PDF and ePub downloads, according to the available data) and Abstracts Views on Vision4Press platform.
Data correspond to usage on the plateform after 2015. The current usage metrics is available 48-96 hours after online publication and is updated daily on week days.
Initial download of the metrics may take a while.