Fig. 2
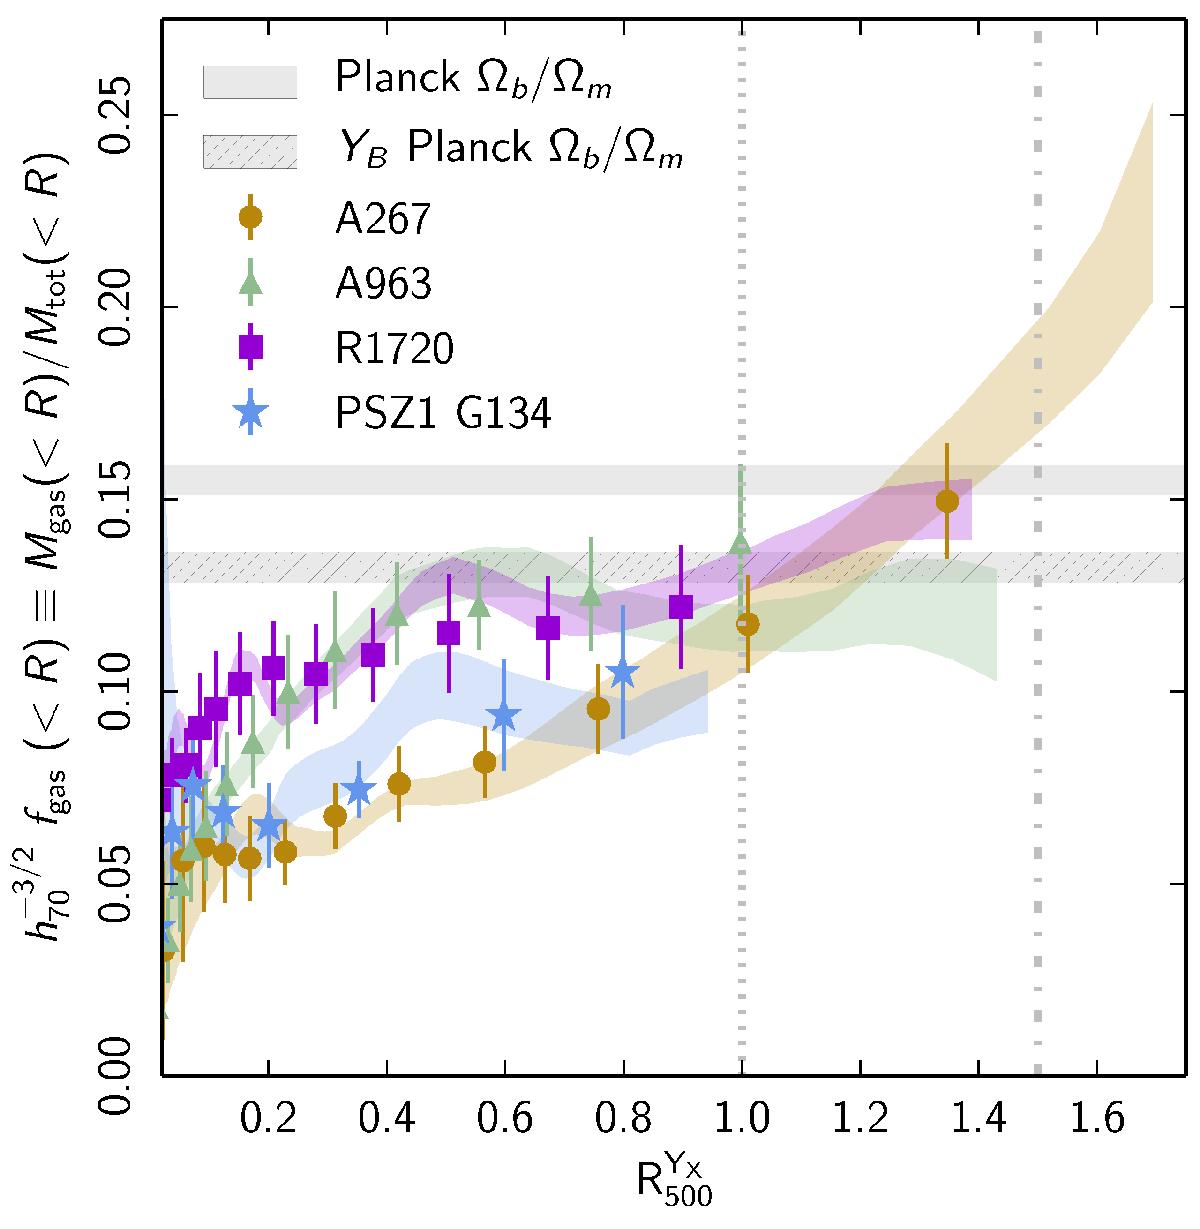
Enclosed gas mass fraction profiles. Points with error bars indicate fgas obtained from the X-day data only; coloured envelopes show the fgas obtained from the X-ray-SZ pressure profile combined with the X-ray density profile (see Sect. 4). The solid grey line shows the cosmic baryon fraction measured by Planck Collaboration XVI (2014); YB = 0.85 is the baryon depletion factor at R500 from the simulations of Planelles et al. (2013). The dot-dashed line indicates R200 ( ~ 1.5 R500).
Current usage metrics show cumulative count of Article Views (full-text article views including HTML views, PDF and ePub downloads, according to the available data) and Abstracts Views on Vision4Press platform.
Data correspond to usage on the plateform after 2015. The current usage metrics is available 48-96 hours after online publication and is updated daily on week days.
Initial download of the metrics may take a while.