Fig. 3
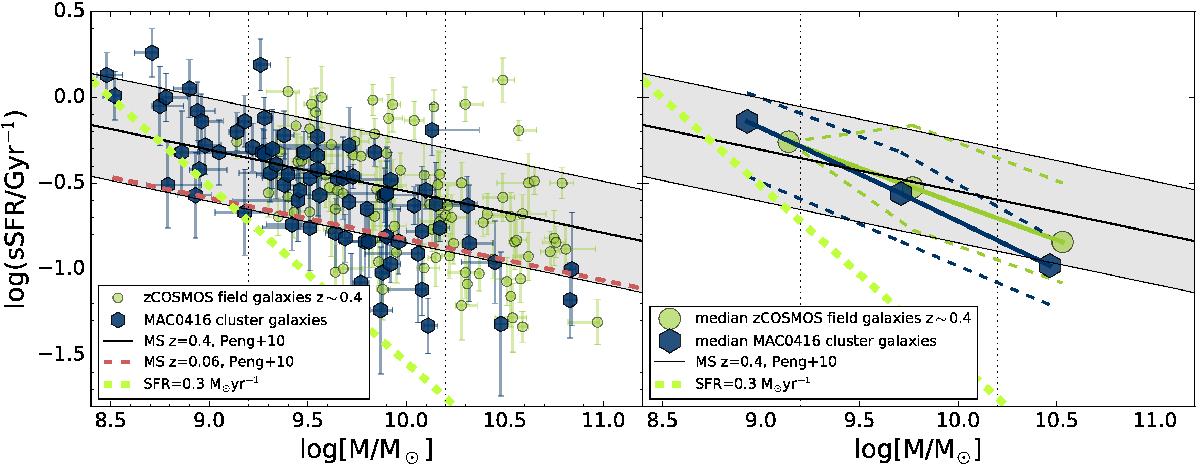
Left panel: mass-sSFR relation for MAC0416 cluster galaxies (blue symbols) and zCOSMOS field galaxies (green) at z ~ 0.4. The oblique solid thick black line shows the MS at z ~ 0.4 and its dispersion (indicated by the gray area), and the dashed red line depicts the local SDSS MS, using Eq. (1) in Peng et al. (2010a) for z ~ 0.4 and z ~ 0.06, respectively. Right panel: median values of the mass-sSFR relations at z ~ 0.4 are shown as blue (cluster) and green (field) solid lines and big symbols, while the corresponding dashed oblique lines enclose 68% of the data. The dashed thick light green line shows the completeness limit of our Zgals cluster sample, SFR ~ 0.3 M⊙/yr.
Current usage metrics show cumulative count of Article Views (full-text article views including HTML views, PDF and ePub downloads, according to the available data) and Abstracts Views on Vision4Press platform.
Data correspond to usage on the plateform after 2015. The current usage metrics is available 48-96 hours after online publication and is updated daily on week days.
Initial download of the metrics may take a while.