Fig. 5
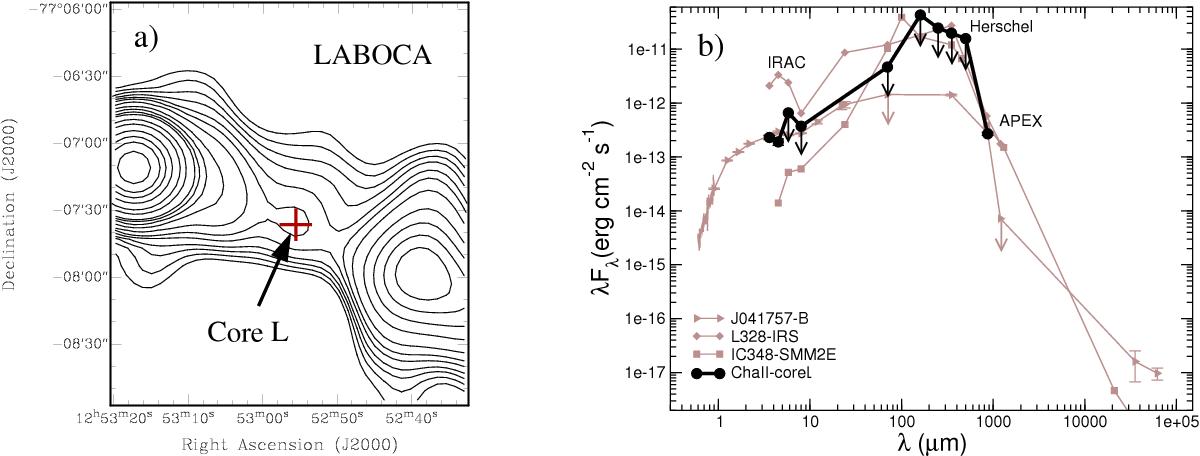
a) Close-up of LABOCA emission at core L (similar contour levels as in Fig. 2). Red cross represents the position of the IRAC 2 Spitzer emission at the position of core L. b) Spectral energy distribution of core L (black thick line) and the proto-BD candidates J041757-B, L328-IRS, and IC348-SMM2E (brown thin lines; Palau et al. 2012, 2014; Lee et al. 2013). Arrows represent upper limits.
Current usage metrics show cumulative count of Article Views (full-text article views including HTML views, PDF and ePub downloads, according to the available data) and Abstracts Views on Vision4Press platform.
Data correspond to usage on the plateform after 2015. The current usage metrics is available 48-96 hours after online publication and is updated daily on week days.
Initial download of the metrics may take a while.