Fig. 3
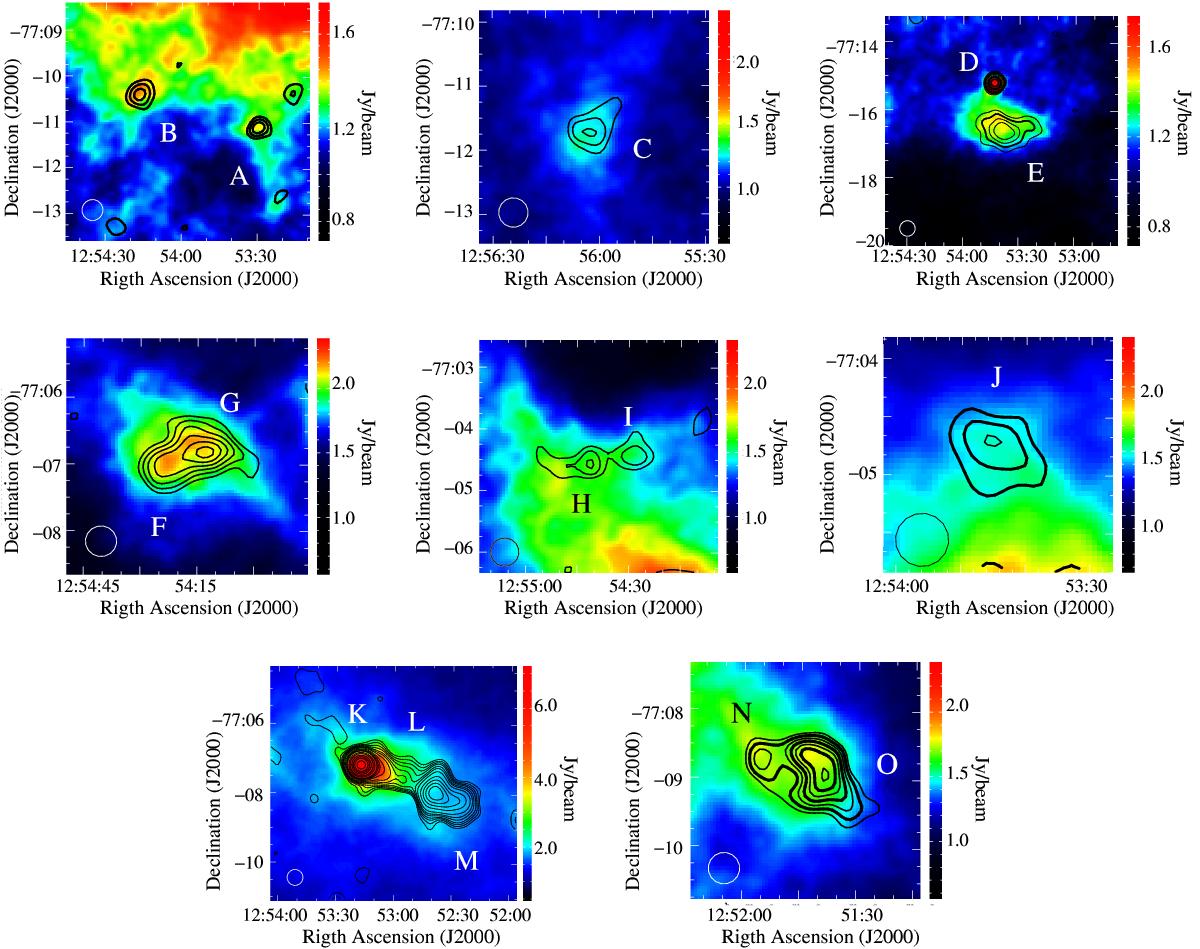
Close-up with details of the submillimetre cores with a S/N ≥ 5. Colours represent the Herschel PACS map at 160 μm superposed onto the background. Contours represent LABOCA emission at 870 μm. Lower contour represents 3σ emission, with an increment of 1σ between contours for all cores, except for the one corresponding to cores K (DK Cha), L, and M, with contours at 3σ, 5σ, 7σ, 9σ, 12σ, 15σ, 20σ, 30σ, 40σ, 50σ, 60σ, 90σ, 120σ, 170σ, 220σ, 270σ, 350σ, and cores D (IRAS 12500-7658) and E, with contours at 3σ, 5σ, 7σ, 9σ, 12σ, 15σ, and 20σ. See different range of values of root mean square (rms) in Table 2.
Current usage metrics show cumulative count of Article Views (full-text article views including HTML views, PDF and ePub downloads, according to the available data) and Abstracts Views on Vision4Press platform.
Data correspond to usage on the plateform after 2015. The current usage metrics is available 48-96 hours after online publication and is updated daily on week days.
Initial download of the metrics may take a while.