Fig. 1
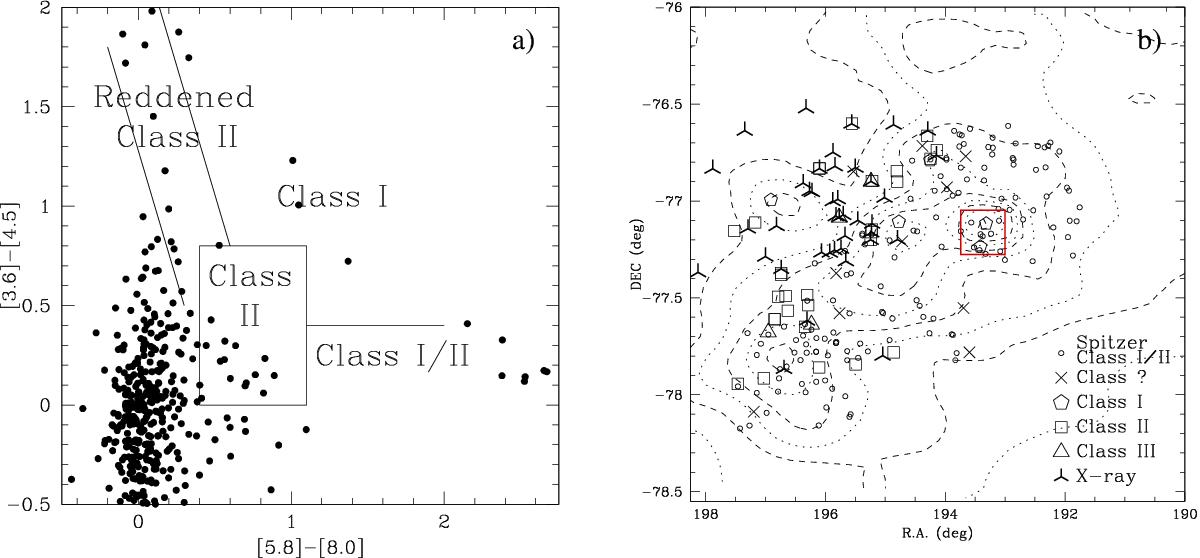
a)Spitzer/IRAC colour–colour diagram, with a classification for Class I, II, and III for candidate members in Cha II. b) Distribution of possible members of Cha II on the sky. The contours correspond to an IRAS map at 100 microns. X-ray sources appear as three-point stars (mostly weak-line T Tauri stars), from the literature. New candidate members, based on our analysis of Spitzer data, are displayed as triangles, squares, pentagons, crosses, and small circles (sources with evolutionary stages between Class I and II), depending on the evolutionary class (i.e. the IRAC IR excess, from a colour–colour diagram following Allen et al. 2004). Red square shows the region selected to be observed with LABOCA, which includes two out of the three Class I objects of the Cha II cloud.
Current usage metrics show cumulative count of Article Views (full-text article views including HTML views, PDF and ePub downloads, according to the available data) and Abstracts Views on Vision4Press platform.
Data correspond to usage on the plateform after 2015. The current usage metrics is available 48-96 hours after online publication and is updated daily on week days.
Initial download of the metrics may take a while.